Home / GIS and Open Map Data for Beginners
GIS and Open Map Data for Beginners
OpenStreetMap and open location data for non-experts: reading map data, first steps in QGIS, and joining community and humanitarian mapping.
- Add a Point by Coordinates in QGIS: Exact Placement With the Digitizing Panel
Clicking a point onto a map is an estimate wearing a costume. When a coordinate pair has to become a feature, a sampling site, a reported location, a surveyed corner, the professional method types the numbers instead. This guide creates the point layer properly, places the point exactly with the Advanced Digitizing Panel, survives the X and Y order trap, and verifies the result before saving it.
- Can Anyone Edit OpenStreetMap? Yes, and Here Is How the Trust System Works
OpenStreetMap really is editable by anyone with a free account, and edits really do go live immediately, with no approval queue. This article explains how a system that open avoids chaos: the rules about what you may copy, what happens to your edit in its first hour and first week, who reviews and reverts, and which kinds of edits must be discussed with the community before you make them.
- Create a Custom Map: Your Own Pins, Layers, and Lines (Free Tools)
A custom map is how you keep the places that matter to you: the trip plan, the delivery round, the family history trail. This guide picks the right free tool first, then builds a complete example map with you, three pins whose coordinates are printed in the article, and teaches the layer method that keeps a growing map organized.
- Embed an OpenStreetMap Map: The Share Iframe, the embed.html URL, and the Library Routes
Embedding OpenStreetMap takes three forms: the Share panel's ready-made iframe, the same embed.html address understood and adjusted by hand with its bbox, layer, and marker parameters, and the library route with Leaflet or MapLibre for maps that must behave like part of your site. This guide builds all three, and ends with the tile usage policy caveat every heavy site must respect.
- Fix Geometry in QGIS: Find Invalid Polygons and Repair Them to Zero Errors
Invalid geometry, self-intersecting polygons, duplicate nodes, rings that cross themselves, quietly breaks area calculations, spatial joins, and exports in QGIS. This guide runs the professional loop: diagnose with Check Validity using the GEOS method, repair with Fix Geometries, then re-check until the error count reaches zero, and explains what the fixer cannot repair for you.
- Geocoding in QGIS: Turn a Table of Addresses Into Points With MMQGIS
Every spreadsheet of addresses is a map waiting to happen, and geocoding is the machine that makes it: street, city, and country in, points on the map out. This guide runs the full QGIS workflow with the MMQGIS plugin, from cleaning the table so the geocoder can read it, through the field mapping and the run, to the file everyone else throws away, the Not Found list, where the real work and the real honesty of the process live.
- GeoJSON to KML: Convert Without Losing Your Data (and What Never Survives)
Converting GeoJSON to KML is one command, but the conversion is lossy in specific, predictable places: extra properties need ExtendedData to survive, styling mostly does not convert at all, and only name and description have guaranteed homes. This guide runs the conversion with ogr2ogr, QGIS, and online tools, and shows how to protect your attribute data before it evaporates.
- GeoJSON to Shapefile: QGIS, ogr2ogr, and GeoPandas Routes, and the Four Things That Break on the Way
Converting GeoJSON to shapefile takes one command or four clicks, and the conversion is the easy part. The real work is knowing what the shapefile format will do to your data on the way in: field names cut to ten characters, mixed geometry types refused, nested properties dropped, and an output that is not one file but a set that must travel together. This guide gives all three routes (QGIS, ogr2ogr, and GeoPandas) and the checks to run before and after.
- GeoJSON Viewer: Open, Inspect, and Validate a GeoJSON File in Your Browser
A GeoJSON viewer turns a wall of bracketed numbers into a map you can interrogate: drop the file in, see the features, click them to read their properties, and catch the classic defects, swapped longitude and latitude, invalid JSON, geometry in the wrong place. This guide compares the main viewers, teaches the inspection routine, and explains the privacy difference between viewers that parse locally and those that upload your file.
- GeoJSON vs Shapefile: The Web Native Text Format Against the Desktop Veteran
The shapefile has stored the world's maps since the early 1990s as a bundle of at least three files with ten character field names and a two gigabyte ceiling, while GeoJSON, standardized as RFC 7946 in 2016, is a single readable text file locked to WGS 84 with longitude written first. Neither is simply better. This comparison lays out the structural differences that decide real projects, storage, attribute limits, coordinate rules, and web use, and names the modern third option, GeoPackage, that increasingly replaces both.
- GeoJSON: Build Your First Map File, Line by Line
GeoJSON is the plain-text format that carries maps around the internet: one small file that says here is a point, here is a path. This beginner-first guide builds a complete, valid GeoJSON file for the Statue of Liberty inside the article, explains the one rule everyone breaks (longitude comes first), and gives you the ocean test for when a file plots wrong.
- GIS for Beginners: A Friendly Path From Zero to Your First Map
GIS is learnable in a month of evenings if the order is right: four ideas, one free program, three small projects. What to learn first, what to install, where free data lives, and the traps and topics to skip for now without guilt.
- GIS Projects for Beginners: Six Small Projects, Fully Specced, Sequenced by Difficulty
Project lists for GIS beginners usually give you titles and wish you luck. This guide gives you six complete specifications instead: the exact data source, the steps in order, the one analysis that makes it GIS rather than drawing, and the finish line that tells you it is done. They are sequenced by difficulty so each project teaches the skill the next one needs, and the first one starts with the neighborhood outside your window.
- Google Maps in QGIS: The Two Working Routes, and the Licensing Catch You Must Know
You can put Google Maps and Google satellite imagery behind your data in QGIS in about a minute, two ways: an XYZ Tiles connection, or the QuickMapServices plugin. This guide gives both, explains the EPSG:3857 behavior you will see, and then covers the part most tutorials skip: Google's terms do not license those tiles for tracing, derived data, or published maps, and the licensed alternatives that do.
- HOT Export Tool: Filtered, Formatted OpenStreetMap Extracts for Field Work
The HOT Export Tool turns OpenStreetMap into a deliverable: describe an area by box, polygon, upload, or coordinates, choose your formats among OSM PBF, shapefile, GeoPackage, KML, and MBTiles, choose data themes or a YAML tag configuration, and download per-format files ready for the field. This guide teaches the export system end to end, including its documented size ceiling.
- HOT Tasking Manager: How Humanitarian Mapping Gets Coordinated, Square by Square
The HOT Tasking Manager is the coordination board of humanitarian mapping: a project divides its area into task squares, a mapper locks one, maps it in iD or JOSM, and marks it mapped, and a second mapper validates the work. This guide teaches the workflow end to end: the project page, task states, lock etiquette, difficulty levels, and what validation actually checks.
- How to Add a Basemap in QGIS: XYZ Tiles in Two Minutes
A blank QGIS canvas is hard to work on; a basemap underneath your data gives every layer a location, a scale, and a sanity check. QGIS ships with the connection half-built: the Browser panel's XYZ Tiles already know OpenStreetMap's address, and adding it takes four clicks. This guide walks that route, shows how to add any tile service by its URL template, explains the Web Mercator behavior that makes basemaps just work, and covers the attribution and fair-use duties that come with free tiles.
- How to Add a Place to OpenStreetMap
Add a missing cafe, shop, or path to OpenStreetMap yourself in one sitting: create a free account, place the point in the iD editor, fill the right fields, and save your first edit.
- How to Add a Shapefile in QGIS: The Whole File Family, the CRS Prompt, and the Zip Trick
Adding a shapefile sounds like opening a file, and it is, once you understand that a shapefile is not a file. It is a family of files that must travel together, and half the failures beginners meet are one sibling left behind. This guide adds a shapefile to QGIS three ways, explains each file in the family, teaches the one dialog you must never guess your way through, and runs the checks that prove the layer arrived intact.
- How to Download OpenStreetMap Data for Any Area
Three routes to OpenStreetMap data as a file, chosen by the size of your area: the Export tab for a neighborhood, Geofabrik extracts for a country, and Overpass when you want only certain features. Formats explained, the attribution line to copy, and what opens each file.
- How to Draw a Polygon in QGIS: Digitizing a Boundary That Closes Cleanly
Drawing a polygon is the moment a QGIS user stops consuming maps and starts making them: a field boundary, a study area, a zoning line, traced vertex by vertex. This guide does it properly, the right layer in the right projection, snapping and tracing so the new boundary respects the old ones, the overlap settings that prevent slivers, and the repair tool that fixes mistakes without a redraw.
- How to Export a Shapefile From QGIS: Save Features As, Without Losing Data
Sooner or later someone asks for your layer as a shapefile: a client, a portal, a legacy system that speaks nothing else. Exporting one is a two-minute job with four traps, fields truncated at ten characters, text mangled by the wrong encoding, a file family shipped incomplete, and a size ceiling from another century. This guide runs the export properly and verifies the delivery the way the receiver will experience it.
- How to Learn GIS: A Four Stage Self Study Plan With an Artifact at Every Stage
Most GIS learning advice is a resource dump: forty links, three platforms, no order, and no way to know when you have actually learned anything. This guide is a plan instead. Four stages in the only order that works, concepts, software fluency, real data and one analysis, then a finished project, each ending in an artifact you can hold up as proof, with an honest ruling on what is worth paying for and what is free forever.
- How to Merge Layers in QGIS: One Layer, Same Geometry, Shared CRS
Twelve district files that should be one province, four quarterly exports that should be one year: merging layers is the janitorial task every GIS workflow eventually demands. QGIS's Merge Vector Layers tool does it in one pass, but only for layers that meet its two conditions, the same geometry type and a shared coordinate reference system, and it will not reproject for you. This guide walks the merge, explains what happens to your attribute fields when schemas disagree, and covers the checks to run before and after so the merged layer deserves your trust.
- How to Read Army Maps and Land Navigation: Grid References, Three Norths, and Terrain
Military land navigation is the most disciplined map reading system ever taught to beginners, built on the 1:50,000 topographic map, a kilometer grid you read right then up, grid references whose digit count sets their precision, five standard map colors, and three norths whose differences are corrected with one angle. This guide teaches the system the way the manuals sequence it, grid first, then direction, then terrain, with the five major terrain features, the lensatic compass in mils, and resection for finding yourself.
- How to Use OpenStreetMap Data: Extracts, Overpass, Formats, and the ODbL Rules
Using OpenStreetMap data means working with the database itself, not the picture on openstreetmap.org. This guide walks the working routes: country and regional extracts from providers like Geofabrik, targeted retrieval with Overpass and the QuickOSM plugin, the formats the data arrives in, PBF, shapefile, and GeoJSON, and the legal layer that travels with every file, the Open Database License, with its attribution duty and its share alike rule for derived databases. It ends with the workflow order professionals use, from question to extract to analysis, so your first project starts clean.
- How to Use OpenStreetMap in a Website: The No Code Embed and the Leaflet Route
Putting OpenStreetMap on your website takes ten minutes by either of two routes. The no code route is the Share button on openstreetmap.org: choose HTML, copy the iframe, paste it into your page, with a marker if you want one. The developer route is Leaflet, the 42 KB open source library this very site loads, pointed at the standard tile layer with the attribution the license requires. This guide walks both routes completely, then covers the part most tutorials skip: the tile usage policy, and the traffic level at which the community servers stop being the right answer and a tile provider or your own server takes over.
- How to Use OpenStreetMap in Flutter: flutter_map, Tiles, Markers, and Search
Flutter has no official Google style map from the OpenStreetMap world, but the community package flutter_map gives you a full OSM map widget in about twenty lines. This guide builds it properly: the TileLayer with the standard tile URL template, the userAgentPackageName the tile policy requires, markers and polylines, tap to coordinates, Nominatim search, and the honest production warning about the public tile servers that every tutorial skips.
- How to Use OpenStreetMap in Python: OSMnx, Overpass, and Nominatim With Real Code
Python is where OpenStreetMap stops being a map you look at and becomes data you compute with. This guide builds the working stack in order: OSMnx for one line downloads of streets and features into GeoPandas, raw Overpass API queries with requests for full control, Nominatim geocoding within its usage policy, and the direct OSM API for reading raw elements, with the user agent and caching rules that keep you welcome on free public servers.
- How to Use OpenStreetMap in QGIS: Basemap, Vector Downloads, and Full Extracts
OpenStreetMap enters QGIS three different ways, and confusing them causes most beginner frustration. The basemap tiles are already built into QGIS as an XYZ layer, two clicks away, but they are pictures, not data. Real vector data arrives through the QuickOSM plugin, which queries the live database for the features in your view, or through downloadable extracts for whole regions. This guide walks all three routes, with the tile URL, the zoom limit, the attribution rule, and the usage policy that keeps your project welcome.
- How to Use OpenStreetMap Offline: Apps, Extracts, and Field Editing Without a Signal
OpenStreetMap may be the most offline friendly map data on Earth, because the whole database can live on your phone. This guide covers the three offline routes: the apps that download regions and navigate from them, OsmAnd, Organic Maps, and CoMaps; the extract route for laptops and field computers, where a downloaded file feeds desktop GIS with no connection; and the field workflow of collecting notes and edits offline and uploading them when signal returns, with JOSM and Field Papers in their proper places. It closes with the staleness contract every offline user signs.
- How to Use OpenStreetMap: A First Session Guide to the Map Itself
Most OpenStreetMap guides rush past using the map and straight into editing it or programming with it. This one stays with the everyday job: opening openstreetmap.org, searching and reading what you find, switching map layers, getting directions, measuring distances, and sharing or embedding the exact view you found, plus an honest list of what the site cannot do so you stop expecting it to.
- How to Use QGIS Plugins: Install, Manage, and the Beginner Set Worth Having
QGIS plugins are where the free GIS grows most of its specialist powers, from OpenStreetMap downloads to extra basemaps to coordinate tools, and they all live behind one dialog that beginners rarely open twice. This guide explains the Manage and Install Plugins window tab by tab, the difference between core and repository plugins, the experimental setting, what to do when a plugin breaks, and the small beginner set, QuickMapServices, QuickOSM, and Lat Lon Tools, that covers most first year needs.
- How to Use qgis2threejs: Turn a QGIS Project Into a 3D Web View
qgis2threejs is the QGIS plugin that turns a desktop project into a 3D view anyone can open in a browser. It takes your DEM and your vector layers and exports them as a self-contained web page built on WebGL: hills you can orbit, buildings extruded from a height field, and a folder you can publish on any web server. This guide covers the whole workflow: preparing the project so the export looks right, the exporter that opens from the Web menu, the setting that lets the viewer run locally, publishing the exported folder, and the glTF export that carries your scene into other 3D tools.
- How to Use the OpenStreetMap API: Four Services, Three First Requests, Zero Blocks
The OpenStreetMap API" is four different services sharing one name, and using the wrong one is how beginners get blocked. The editing API reads raw map data and needs no key. Nominatim turns names into coordinates at one request per second. Overpass answers questions like "all cafes near here". The tile servers are none of these and punish bulk use. This guide decodes the four, gives you three copyable first requests including a Python one, and lists the rules that keep you welcome.
- Is OpenStreetMap Free? The License, the Costs, and the Fine Print
Yes, OpenStreetMap data is free, including for commercial use, under the Open Database License. But free has fine print, and this guide reads it: attribution is mandatory, share alike applies to databases you derive, the project's own tile servers and geocoder run under usage policies that heavy users must not lean on, and hosting your own copy is where real costs live. A complete audit for users, businesses, and builders.
- JOSM: The OpenStreetMap Desktop Editor for Mappers Who Outgrow iD
JOSM is the Java desktop editor that serious OpenStreetMap contributors graduate to: it edits relations comfortably, validates your work before upload, works fully offline, and carries more than 200 keyboard shortcuts and over 100 plugins, at the price of a genuinely steep learning curve. This guide is the decision and first session in one: who JOSM is for, what to install and set up, and the features that justify the climb, drawn from the OSM Wiki's own record.
- Kriging in QGIS: Interpolation With a Semivariogram, and When IDW Is Enough
QGIS interpolates natively with IDW and TIN, but it ships no native kriging: kriging lives in the SAGA and GRASS providers inside Processing, and in the Smart Map plugin. The difference is the semivariogram, a model of how similarity decays with distance, estimated from your data instead of guessed. This guide teaches where kriging hides in QGIS, what the semivariogram buys, and the honest rule for when IDW is enough.
- LiDAR in QGIS: Native Point Clouds From LAS to 3D
Since QGIS 3.18, point clouds are native citizens: LAS and LAZ load through the Data Source Manager's Point Cloud tab, convert to EPT on first load, render in 2D and in true 3D views, style by classification, elevation, or RGB, and process through dedicated Processing groups. COPC and VPC support followed. This guide teaches the native workflow end to end, and where to get free data, USGS Earth Explorer first.
- Merge Polygons in QGIS: Dissolve, Done Right
Merging polygons in QGIS usually means one specific operation: Dissolve, which groups features inside a single layer by a shared attribute value and removes the boundaries between them. This guide teaches Dissolve properly, its fields, its multipart behavior, the keep-disjoint switch, the blank-field collapse, and the geometry cleaning that must come first, then separates it from the two operations it is confused with: merging layers, and merging selected features by hand.
- National Map Data Download: The USGS Doors, and Which One Your Data Lives Behind
The National Map is not one download page but a family of USGS services, and most failed downloads are really a wrong door: the main Download Client for current data products like elevation, hydrography, place names, structures, boundaries, and transportation; topoView for topographic map sheets, historical and current; LidarExplorer for lidar point clouds; topoBuilder for custom OnDemand Topos; and the Map Locator for older maps and paper. This guide routes you to the right door by the data you actually need, and covers the map services and API for programmatic access.
- Network Analysis in QGIS: Shortest Paths and Service Areas on Your Own Streets
QGIS ships a native Network Analysis library in Processing: shortest path between points, from a point to a layer, from a layer to a point, and service areas computed along the network, all on your own line layer, with direction rules and speed fields. This guide teaches the four core algorithms, the topology demands underneath them, and where the native tools end and the QNEAT3 plugin begins.
- New Layer From Selection in QGIS: Turn Chosen Features Into Their Own Dataset
A selection is an answer, but it evaporates: close the project, clear the highlight, and the features you so carefully isolated are anonymous again. Promoting a selection into its own layer makes the answer permanent, a dataset you can style, share, and analyze. This guide makes the selection well, promotes it by both QGIS routes, and warns about the scratch layer that disappears when the project closes.
- Offline Maps in QGIS: Generate Your Own MBTiles Tile Pack
Most offline map guides tell you which app to download areas in. This one is for the other end of the pipeline: making the offline tile file yourself, in desktop QGIS. The tool is Generate XYZ tiles (MBTiles) in the Processing Toolbox: set an extent, a minimum and maximum zoom, and a tile format, and QGIS renders your layers into a single .mbtiles pack that field apps can read with no network. This guide covers the zoom math that decides file size, the tile usage policy that decides which sources you may lawfully tile, and the test that proves the pack works before the trip.
- Open Map Data: What It Is, What the Licenses Let You Do, and Where to Get It
Open map data" gets used loosely for anything free to look at, but the term has a precise meaning: map data you may use, change, and redistribute, including commercially, under a license whose main demand is credit. This article defines the term properly, decodes the licenses you will actually meet (ODbL, the Open Government Licence, public domain) into may-I-use-it answers, and introduces the major free sources, from OpenStreetMap to government portals to Natural Earth and GeoNames.
- Open Map Database: What Is Actually Stored, and How the Big Ones Differ
People say "open map database" as if it were one thing, usually meaning OpenStreetMap. Underneath the map picture there is a real database with a learnable anatomy: nodes, ways, relations, and tags, which this guide opens up using one cafe stored as one record. Then it separates the three big open databases, OpenStreetMap, Overture Maps, and Natural Earth, by structure, license, and update rhythm, so you can choose the right one for a project instead of the famous one.
- OpenStreetMap (OSM): The Wikipedia of Maps, Explained for Beginners
OpenStreetMap is a map of the whole world drawn by its users and free for anyone to use. What it is, how a cafe becomes data, where you already use OSM without knowing it, its honest strengths and gaps, and how it differs from Google Maps in the one way that matters: who owns the map.
- OpenStreetMap Attribution: How to Credit OSM Correctly on Any Medium
OpenStreetMap data is free to use, and the price is attribution: credit the OpenStreetMap contributors and link to the copyright page, in a place where users of your map will actually see it. This guide turns the Open Database License and the community's attribution guidance into practical instructions per medium, interactive map, static image, print, and data product, and draws the line that decides the hard cases: the difference between a produced work and a derivative database, which is where share-alike actually applies.
- OpenStreetMap Basemaps: One Dataset, Many Faces
Every OpenStreetMap basemap is a portrait of the same sitter. The Standard layer, the cycling layers with their contours and routes, the Transport Map, and the Humanitarian style are all renderings of one shared dataset, drawn by different cartographers for different readers. This guide tours the featured layers on openstreetmap.org, explains what each one emphasizes and hides, and teaches the diagnostic skill the layers make possible: when a road is missing from one face of the map but present in the data, you are looking at a rendering choice, not a mapping error.
- OpenStreetMap Building Footprints: Extract Them by the Route That Fits Your Area
Building footprints are the most requested single feature in OpenStreetMap, and the extraction route depends entirely on how much ground you need: the Export tab for a neighborhood, an Overpass query for a town, a Geofabrik extract plus filtering for a region. This guide walks each route, shows the building=* query pattern, explains why courtyards arrive as multipolygon relations, tells the truth about heights, sparse tags and the levels-times-three-meters estimate, and covers the ODbL attribution and share-alike duties and Overpass fair-use limits that come with the data.
- OpenStreetMap Building Height: The Simple 3D Buildings Tag Scheme, Taught Whole
OpenStreetMap's flat outlines become 3D buildings through one tag scheme: height measured to the top of the roof, min_height for raised parts, building:levels counting floors above ground, building:part for the pieces that differ, and the roof: family for shape and height. This guide teaches the Simple 3D Buildings scheme from the OSM wiki, with one building tagged completely, and the height against levels distinction the wiki itself insists on.
- OpenStreetMap Custom Style: Writing Your Own osm-carto Style in CartoCSS
The standard OpenStreetMap style, openstreetmap-carto, is written in CartoCSS: a project file and a set of MSS stylesheets that the carto compiler turns into the mapnik.xml a renderer consumes. This guide teaches the authoring system: the project structure, variables, filters, and attachments, from a one-color change to a full fork, with CyclOSM as the proof of what a fork can become.
- OpenStreetMap Editor Guide: iD, JOSM, and Your First Safe Edit
OpenStreetMap has several editors and the choice confuses every beginner. This guide compares iD, JOSM, and the phone editors in one chooser table, tours the iD screen and its three drawing tools, and gives a safe-first-edit routine plus a pre-upload review checklist, so your first contribution helps the map instead of needing rescue.
- OpenStreetMap History: Versions, Changesets, and How Deleted Features Come Back
Every OpenStreetMap feature carries its full biography: a history page listing every version, the changesets that created them, and the editors who made them. This guide reads that biography, covers the JOSM history window and the Achavi and OSMCha viewers, explains why moving a way's nodes does not raise the way's version, and walks the recovery of a deleted feature through Overpass attic data.
- OpenStreetMap MBTiles Download: One SQLite File Holding a Whole Map
An MBTiles file is a tile pyramid packed into a single SQLite database: one file you can copy, carry, and open offline. This guide covers the format itself, the routes to download or create an OpenStreetMap MBTiles file, the zoom-range and file-size discipline that decides whether a download is sane, and the apps and tools that read the format in the field.
- OpenStreetMap Neighborhood Boundaries: Relations with Polygons, Nodes Without
A neighborhood in OpenStreetMap is one of two different objects: an administrative boundary relation, boundary=administrative at a local admin_level, which carries a true polygon, or a place=neighbourhood node, a labeled point with no outline at all. This guide teaches both species, how boundaries are extracted through Nominatim and Overpass, and what each species means for anyone who needs the outline.
- OpenStreetMap Nominatim: The Geocoder, Its Endpoints, and Its House Rules
Nominatim is the search engine that turns OpenStreetMap data into answers: give it an address and it returns coordinates, give it coordinates and it returns the address. It runs behind the search box on openstreetmap.org and as a public service anyone may call, provided they obey a short, strict usage policy. This guide explains the three endpoints that matter, what a well-formed query looks like, and the house rules, one request per second, no autocomplete, cache your results, that separate a welcome guest from a blocked one.
- OpenStreetMap on Garmin: Load OSM Maps Onto Your Device, Two Routes
Garmin devices can navigate on OpenStreetMap data, and there are two routes onto the hardware: download a pre-made routable map image and copy it into the Garmin folder as a gmapsupp file, or build your own image with mkgmap, with your choice of contours and routing options. This guide walks both routes from the OSM wiki's OSM Map On Garmin pages, with the file-placement discipline that decides whether the map appears at all.
- OpenStreetMap Opening Hours: The opening_hours Grammar, Decoded
The opening_hours tag is a small formal language: two-letter weekday codes, 24-hour time ranges, comma-separated intervals, semicolon-separated rule sets where later rules override earlier ones, off for closed, PH and SH for holidays, sunrise and sunset as time terms, and 24/7 for always open. This guide decodes the grammar from the OSM wiki's key page and specification, with worked examples from a shop's simple week to a seasonal schedule.
- OpenStreetMap PBF: The Binary Format the Planet Travels In
The OpenStreetMap planet file moves around the world as .osm.pbf, a binary format holding the same nodes, ways, and relations as OSM XML at about half the size of a gzipped XML file, built from independently decodable fileblocks, string tables, and delta-encoded coordinates. This guide explains how PBF is put together, when it beats XML, and how the two convert without loss.
- OpenStreetMap Power Lines: The power Key Family and the Grid It Draws
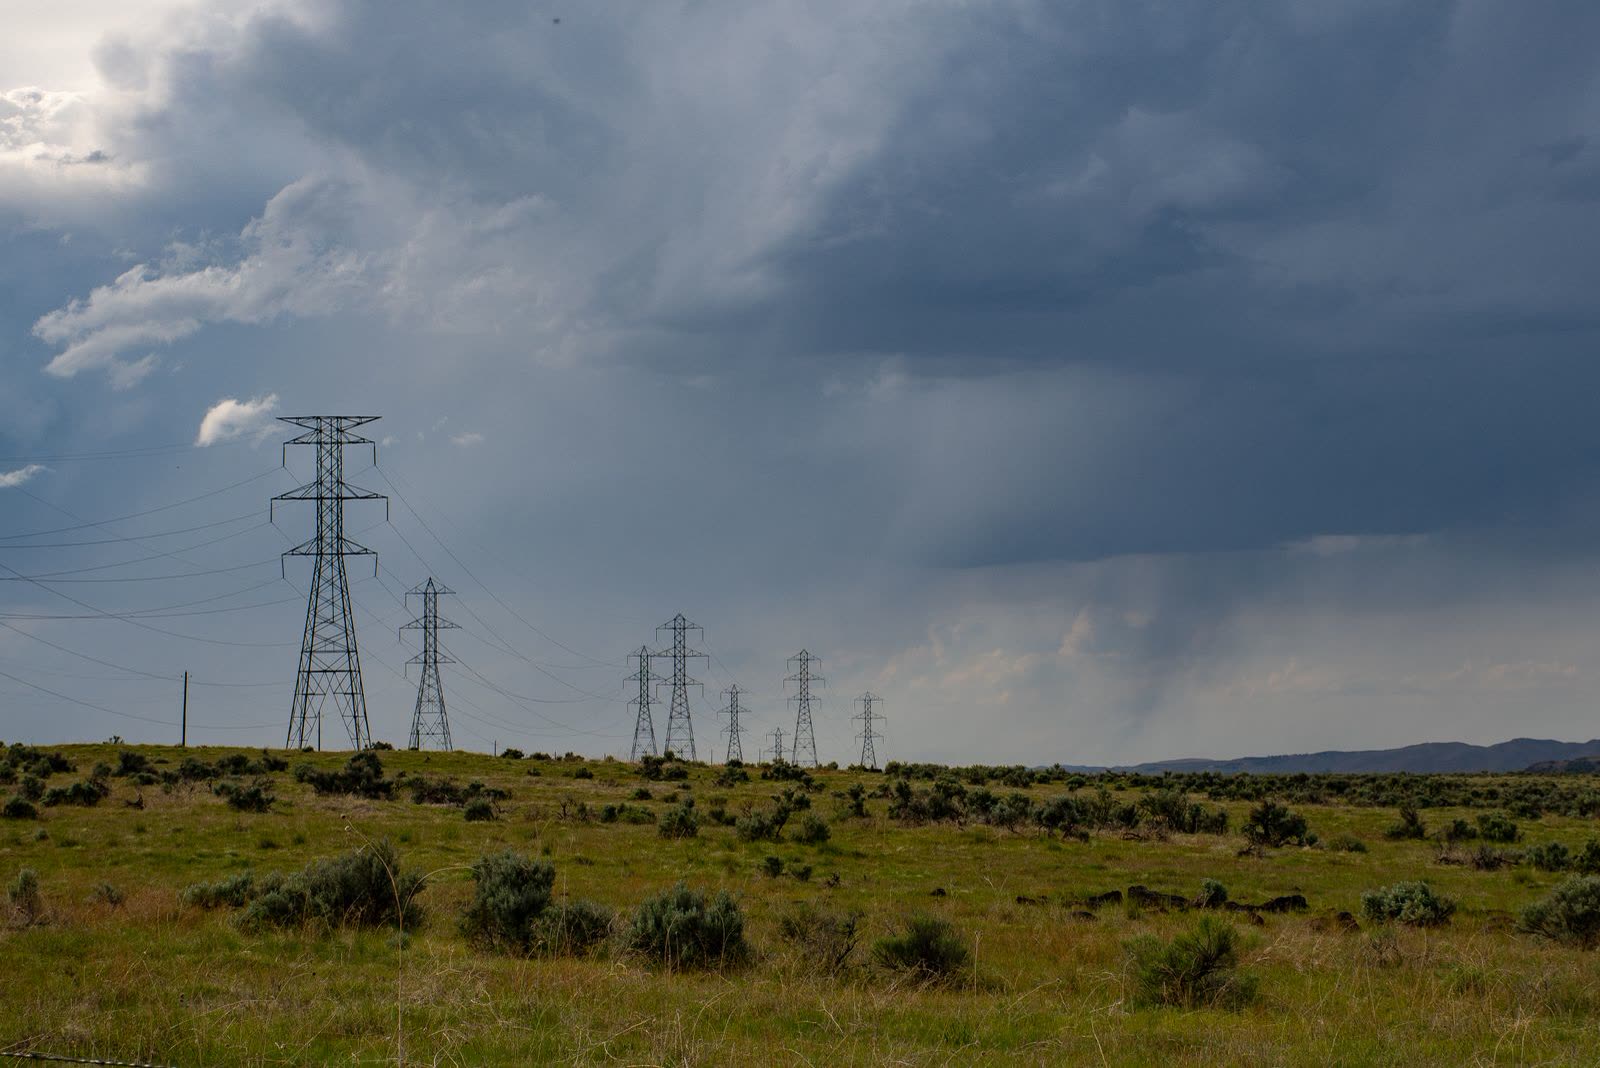
The electricity grid is hiding in OpenStreetMap under the power key: power=line and cable for the conductors, tower and substation for the furniture, voltage and circuits and operator as the attributes that make it a network. This guide teaches the tag system, the grid maps and energy datasets built from it, and the completeness caveat every honest consumer of this data prints.
- OpenStreetMap Report Errors: Notes, the Fixer's Front Door
The fastest way to report a map error on OpenStreetMap is a Note: a marker any visitor can drop without an account, saying what is wrong at that spot, which local mappers then comment on, fix, and resolve. This guide uses the Notes system end to end, teaches what a good note says, and covers the lifecycle, the editor integrations, and the standing rules, from the OSM wiki's Notes page.
- OpenStreetMap Routing: OSRM, Valhalla, GraphHopper, and Which One to Call
OpenStreetMap itself does not route you anywhere; the routes come from a family of engines that read its data, each with a different design. OSRM and GraphHopper precompute their speed into the graph, Valhalla prices each request on the fly, and OpenRouteService wraps routing in a hosted service with its own specialties. This guide explains how routing on OSM data actually works, what separates the four engines, when the public demo servers are fair to use, and how to choose between calling an API and running your own router.
- OpenStreetMap Speed Limits: The maxspeed Tag System and the Defaults Behind It
A speed limit in OpenStreetMap is the maxspeed tag: a plain number read as kilometers per hour, explicit units written with a space, special values like none, implicit country and zone codes, and source tags recording where the limit came from. Behind the tags stand the wiki's default tables that routers fall back on. This guide teaches the whole system as the decision chain a router actually follows.
- OpenStreetMap Tags Explained: How key=value Describes the Whole World
OpenStreetMap describes everything on earth, every road, river, cafe, and bench, with one tiny invention: the tag, a key and a value joined by an equals sign. This guide explains how tags attach to nodes, ways, and relations, how keys and values divide the work of describing, the house rules that keep millions of editors consistent, and where the conventions live, in the wiki and the Taginfo census.
- OpenStreetMap Tile Server: How the Tiles You See Are Made, Cached, and Served
Every slippy map on the internet is a pyramid of small squares: 256 by 256 pixel tiles addressed as z/x/y, one tile for the whole world at zoom 0, four times as many at every level deeper. This guide explains how OpenStreetMap tiles are rendered from the database, cached, and served, what the public tile.openstreetmap.org service is and is not, and what the project's Tile Usage Policy means for anyone building on it: light use is a gift, heavy use means running your own server or paying a provider, and either way the math of the pyramid decides your budget.
- OpenStreetMap uMap: Build a Custom Map With Layers, Imports, and a Backup
uMap is the OpenStreetMap ecosystem's custom map maker: sign in with an OSM account, build maps from layers, draw markers, lines, and polygons, import GeoJSON, GPX, KML, and CSV data, shape pop-ups with templates, control who can edit, and export the whole map as a backup file. This guide builds one properly, with the layer discipline and backup habit the training pages assume.
- OpenStreetMap Vector Tiles: Data Tiles, a Separate Style, and Client Rendering
A vector tile is not a picture of a map. It is the map's data, cut into squares and shipped to the browser, where a style document decides how it looks and the device does the drawing. This guide explains how vector tiles differ from the raster tiles OpenStreetMap is known for, the MVT specification underneath, the renderers and generators, and the honest costs of the approach.
- OpenStreetMap vs CARTO: Free Map Data vs a Cloud Location Intelligence Platform
OpenStreetMap and CARTO are not two versions of the same thing. One is a free, editable database of the world, licensed under the ODbL. The other is a commercial cloud platform for analyzing location data, with a visual builder, SQL analytics that run inside BigQuery and Snowflake, and enterprise pricing. This comparison separates the three things the name CARTO can mean, and helps you decide whether you need data, a platform, or both.
- OpenStreetMap vs Google Maps: An Open Database Against a Closed Service
These two are not the same kind of thing, and that is the comparison. Google Maps is a service you look through; OpenStreetMap is a database you can take. This guide compares them as a driver, as a hiker, and as a builder: coverage, editing, offline rights, licensing, and the API bill, with a verdict for each role and the hybrid setup most serious users end up running.
- OpenStreetMap vs Leaflet: Data vs Library, the Distinction That Ends the Confusion
OpenStreetMap and Leaflet are not competitors, and comparing them directly is a category error that confuses every beginner who meets them in the same tutorial. OpenStreetMap is a database of the world, maintained by contributors. Leaflet is a small JavaScript library that draws interactive maps in a browser, and it ships with no data at all. This guide separates the two cleanly, shows how they combine in the standard web map stack, and states what each costs, licenses, and cannot do alone.
- OpenStreetMap vs Mapbox: Free Community Data vs a Hosted Mapping Platform
OpenStreetMap and Mapbox are not two versions of the same thing. OpenStreetMap is a free, community built database of the world, licensed for reuse under the ODbL. Mapbox is a commercial platform of hosted maps, styling, geocoding, and routing APIs that itself builds partly on OpenStreetMap data. This comparison separates the layers, data, tiles, search, routing, license, and cost, so you can tell whether your project needs the commons, the platform, or the common professional answer: Mapbox services on top, with OSM data underneath.
- OpenStreetMap vs Overture Maps: The Living Database vs the Production Snapshot Built on Top of It
Overture Maps is not a rival to OpenStreetMap; it is built on it. Founded in December 2022 by Amazon, Meta, Microsoft, and TomTom, Overture republishes the world's map data, much of it from OSM, as monthly GeoParquet releases with a stable schema and stable IDs (GERS) for production pipelines. This guide explains what Overture adds, the licensing split between its six themes, and how to choose between the living database and the curated snapshot.
- OpenStreetMap Waterways: The waterway Key Family, from Rivers to Drains
Water in OpenStreetMap is two geometries wearing one theme: linear waterways tagged with the waterway key, river, stream, canal, drain, ditch, and water areas tagged natural=water. This guide teaches the key family as a data system: the values and what separates them, intermittent and seasonal flow, tunnels and culverts, and how extract layers such as Geofabrik's classify the flow of the world.
- OpenStreetMap WMS: The Request-Driven Map Service, and When to Use It
A WMS server draws OpenStreetMap data fresh for every request: you name the bounding box, the image size, the layers, and the coordinate system, and the server renders exactly that map. This guide teaches the Web Map Service standard against the tile pyramid's fixed grid, the GetCapabilities and GetMap requests, the third-party servers that serve OSM data this way, and how to consume them in QGIS, JOSM, and iD.
- OpenStreetMap ZIM File: The Wiki in a File, and Maps in a File
A ZIM file is an offline archive format read by Kiwix, and two different OpenStreetMap species travel in it: the OpenStreetMap wiki itself, packaged for offline reading, and map ZIMs such as StreetZim that pack rendered map data into one file. This guide separates the two species, teaches how to get and read each, and shows how to judge a ZIM's freshness from its filename before you depend on it.
- OpenStreetMap Zoom Levels: What You Can See From Level 0 to 19
Every slippy map, OpenStreetMap included, is built on a ladder of zoom levels, 0 to 19 on the standard layer, where each step doubles the tiles in each direction and halves the size of a ground pixel. This guide explains the tile pyramid behind the ladder, gives the meters-per-pixel figures at the equator for the key levels, and matches each rung to what you can actually see and do there.
- Overpass Turbo: Query OpenStreetMap Like a Database, From Wizard to Export
Overpass Turbo turns OpenStreetMap into an answerable question: every bench in a town, every drinking water point along a trail, every bakery in a district. Its Wizard converts plain words into Overpass QL, the query language with its [out:json][timeout:25]; header, node, way, and relation filters, and map or area bounds. This guide runs the full workflow from a plain English term to a working query to an exported file you can use anywhere.
- QField for QGIS: Package the Project, Collect in the Field, Sync It Back
QField takes a QGIS project into the field on a phone or tablet, and the QFieldSync plugin is where the system is decided: per layer, you choose Copy, Offline editing, or Remove, then package by cable or push to QFieldCloud, collect against forms you designed in QGIS, and synchronize back with multi-user changes merged through the offline editing log. This guide teaches that packaging decision, the one that decides whether two surveyors' work merges or collides.
- QGIS Advanced Digitizing: The CAD Panel, Its Keyboard Locks, and Construction Mode
The Advanced Digitizing panel is QGIS's CAD constraint system: it draws lines at exact distances, exact angles, and exact coordinates, locks them from the keyboard with the d, a, x, and y keys, builds parallels and perpendiculars, and holds constraints in continuous lock. This guide enables the panel, separates it from the toolbar that shares its name, and teaches the precision workflow from the QGIS documentation's editing chapter.
- QGIS and GDAL: The Library Under the Hood and Its Command Line
GDAL and its vector twin OGR are the library layer under QGIS: the drivers that read and write your formats, the Processing provider behind the Raster and Vector menus, and a command line, ogr2ogr, ogrinfo, gdal_translate, that turns format work into scriptable one-liners. This guide teaches the library itself: the driver model, the utilities that matter, VRT virtual datasets, and when to drop from the GUI to the shell.
- QGIS Atlas: One Layout, Forty Maps, or However Many Features You Have
Atlas is the QGIS print layout feature that turns one designed map into a series: point the layout at a coverage layer, set the map item to Controlled by Atlas, and QGIS generates one page per feature, a map of every district, parcel, or trail segment, each framed, titled from its attributes, and exported as one multi-page PDF or a file per feature. This guide builds the whole thing in order, from coverage layer to export.
- QGIS Browser Panel: The Front Door to Your Data
The QGIS Browser panel is the program's front door: a single tree that reaches your folders, GeoPackages, databases, and web services, with favorites, spatial bookmarks, filtering, and drag-and-drop loading. This guide teaches the panel as a system, its branches and shortcuts, its mirror inside the Data Source Manager, and the habits that turn it from furniture into the fastest way into any dataset.
- QGIS Calculate Area of a Polygon: $area, area($geometry), and the Degrees Trap
QGIS offers two area functions that answer different questions: $area respects your project's ellipsoid and measurement settings and returns real world ground area, while area($geometry) computes flat planimetric area in whatever units your layer's CRS uses, which for an EPSG:4326 layer means square degrees, a number with no physical meaning. This guide separates the two, walks the field calculator workflow, and gives the exact conversions for hectares and acres.
- QGIS Clip Raster: Cut Imagery and DEMs to Your Boundary With a Mask Layer
Rasters arrive as rectangles and study areas are never rectangles, so clipping is the first real operation most GIS work performs on imagery and elevation data. In QGIS, Clip Raster by Mask Layer cuts a raster to the shape of a polygon layer, keeping the cells inside your boundary and writing NoData outside it. This guide covers the pre-flight checks that prevent empty outputs, the run itself step by step, the three decisions that shape the result, NoData, resolution, and extent, and how to verify the clip did what you think it did.
- QGIS Cloud: The Hosted Route from Desktop Project to Web Map
QGIS Cloud publishes a QGIS project one-to-one to a hosted QGIS Server through a desktop plugin: your layers, styles, and layouts become web maps plus WMS, WFS, and WCS services without a server of your own. This guide covers how the publishing flow works, what the viewer is, what the free tier's limits mean, and how to weigh the hosted route against running QGIS Server yourself.
- QGIS Elevation Profile: Read the Terrain Along Any Line You Draw
The Elevation Profile panel in QGIS turns a drawn line into a terrain cross-section: distance along the bottom, elevation up the side, with the curve updating as you add DEMs, meshes, and other layers. This guide sets up a terrain source, draws and reads a profile, refines it with tolerance and multiple layers, and exports the result for reports and route planning.
- QGIS Export Attribute Table to Excel: XLSX, CSV, and the Geometry Decision
Exporting a QGIS attribute table to Excel is one operation with three decisions hidden inside it: real XLSX against CSV, which fields travel, and what happens to the geometry, written as coordinates, written as WKT, or dropped entirely. This guide walks the Save Features As route step by step, covers the selected-features and copy-paste routes, and names the traps that corrupt spreadsheets quietly.
- QGIS Expression Builder: The One Dialog Behind Selection, Fields, and Styles
QGIS has a second language, and one dialog teaches it everywhere it is spoken. The Expression String Builder appears when you select by expression, calculate a field, drive a label, override a style property, or generate geometry, and it is the same dialog every time: a function list grouped by family, a field and values browser, a live preview that confesses errors before you commit, and a Function Editor tab for saving your own reusable functions. This guide teaches the dialog once, properly, so every tool that hosts it becomes easier.
- QGIS Field Calculator: Build and Fix Attributes With Expressions
The Field Calculator is where a QGIS layer's attribute table becomes programmable: an expression engine that can create new fields, update existing ones, compute areas, concatenate labels, and classify features with CASE logic, with a live preview before anything is written. This guide teaches the dialog, the first expressions worth learning, and the mistakes, type mismatches, NULLs, truncated text, that bite beginners.
- QGIS GeoPackage: One File for Every Layer, From Creation to Sharing
The shapefile taught a generation of GIS users to send seven files and pray: lose the .dbf and your attributes vanish, lose the .prj and your coordinates float free. The GeoPackage ends that era: an OGC standard built on a single SQLite file that holds many vector and raster layers at once, has been the QGIS default format since the 3.x line, and travels by email, drive, or USB stick as one honest file. This guide creates one properly, fills it, moves layers between packages in the Browser panel, and explains the Package Layers habit that makes whole projects portable.
- QGIS GRASS GIS Integration: Locations, Mapsets, and Several Hundred Modules
QGIS reaches GRASS GIS, the oldest and deepest open-source analysis engine, through three distinct doors: browsing GRASS databases in the Browser, running GRASS modules as a Processing provider, and the GRASS plugin with its own tools. This guide teaches the integration machinery and the project, location, and mapset data model underneath it, as worked from inside QGIS.
- QGIS Heatmap: The Renderer for a Picture, the KDE Algorithm for a Raster
QGIS offers two different things called heatmap, and choosing between them is the first skill: the heatmap symbology renderer draws a live density picture from your points and stores nothing, while the Processing algorithm Heatmap (Kernel Density Estimation) computes a real raster you can analyze, with kernel shapes from Quartic to Epanechnikov, a radius, a pixel size, and an optional weight field. This guide builds both, explains every parameter in plain terms, and teaches the honesty rule: a heatmap without its radius and kernel stated is a picture, not a result.
- QGIS Hillshade: Turn a DEM Into Readable Terrain, and Fix the Z-Factor Trap
A hillshade fakes sunlight across a DEM so terrain reads at a glance: ridges, valleys, and scarps pop out of what was a flat gray ramp. This guide makes one in QGIS with the standard recipe, explains what the azimuth and altitude defaults of 315 and 45 degrees really do, and fixes the Z-factor trap that turns degree-based DEMs into melted wax.
- QGIS Inset Map: A Second Frame, an Overview Rectangle, and a Scale of Its Own
An inset map is a second map frame living on the same print layout as the main map: a zoomed detail, a locator, each bound to its own map theme with locked layers, its own scale, and an overview rectangle on the main frame showing exactly where the inset looks. This guide builds one in QGIS Print Layout the disciplined way, theme per frame, lock before you style.
- QGIS Join Attributes by Field Value: Attach a Table to Your Layer by a Shared Key
A field-value join is a spreadsheet lookup for maps: match rows in a table to features in a layer by a shared key, a code, a name, an ID, and the table's columns appear on the map. This guide sets up both QGIS routes, the live layer join and the processing tool, diagnoses the all-NULL failure caused by mismatched key types, and handles one-to-many joins without corrupting your data.
- QGIS Join by Attribute: The Live Joins Tab, From Shared Field to Saved Project
QGIS offers two different operations that both get called a join, and confusing them wastes projects. The Processing algorithm, Join Attributes by Field Value, bakes a new layer. The Joins tab in Layer Properties does something subtler and often better: a live join that hangs a table off your layer by a shared field, updates when the table changes, lives in your project, and vanishes unless you save the project or export the layer. This guide runs the live join properly, field by field, and teaches when each kind of join is the right one.
- QGIS Keyboard Shortcuts: The Defaults by Task, and How to Rebind Them
QGIS rewards the keyboard: project shortcuts, canvas navigation, editing controls, and the attribute table all carry default bindings, and every one of them can be searched and rebound in the Keyboard Shortcuts dialog under Settings. This guide organizes the defaults by the job you are doing, covers the macOS substitutions, and teaches safe rebinding, so the shortcut set becomes yours without breaking the program's grammar.
- QGIS Long Term Release (LTR): The Release Calendar, Point Releases, and How to Plan Around Them
QGIS ships a new release every four months, and every third release becomes a Long Term Release, maintained with monthly bug-fix-only point releases until the next LTR takes over. This guide teaches the machinery itself: how to read the QGIS Road Map schedule table, what feature freeze means, how an LTR enters and leaves maintenance, and how to plan upgrades a year out around the calendar instead of reacting to it.
- QGIS LTR vs Latest: Which Version to Install, and Why Plugins, Not Features, Should Decide
QGIS ships a new version every four months, and every third one becomes the Long Term Release, supported with bug fixes for at least a year. The project's own advice to the unsure is simple: download the LTR. This guide explains the release train, what actually differs in daily work (plugin compatibility and project file behavior matter more than features), and the decision rule for production machines, classrooms, and curious individuals.
- QGIS Open GDB: Read a File Geodatabase With the OpenFileGDB Driver
A file geodatabase arrives as a folder ending in .gdb, and QGIS opens it through GDAL: the built-in OpenFileGDB driver in every standard install reads one without any Esri software, with write support for new geodatabases since GDAL 3.6 as bundled from QGIS 3.28, and raster contents readable since GDAL 3.7. This guide opens one step by step, separates the two drivers honestly, and teaches the export-to-GeoPackage escape hatch for real editing.
- QGIS Print Layout: Compose a Map Someone Can Actually Use
The map on your QGIS canvas is a working view; the map in a print layout is a finished argument, with a fixed scale, a legend that explains it, and a page designed for a reader who cannot pan, zoom, or ask you questions. This guide builds a layout from a blank page to a proofed export: placing the map, locking a deliberate scale, adding the furniture that makes a map trustworthy, and choosing between image, SVG, and PDF exports, including the georeferenced kind that carry their coordinates with them.
- QGIS Processing Toolbox: Run It Once, Then Batch It, Then Model It
The Processing framework is QGIS's engine room: a Toolbox holding hundreds of algorithms from QGIS itself, GDAL, GRASS, and SAGA behind one search box, a History that logs every run with its settings, a Batch Processing interface that runs one algorithm over many datasets, and a Model Designer that chains algorithms into new tools. This guide teaches the four as one progression.
- QGIS Raster Calculator: Band Math, Worked Expressions, and the Nodata Traps
The Raster Calculator is where QGIS stops displaying grids and starts computing with them: one expression, written in band references like "dem@1", produces a brand new raster, a vegetation index from satellite bands, a reclassified slope, a flooded plain at a chosen water level. This guide builds expressions the safe way, works a full NDVI example with numbers you can check by hand, and catalogs the traps that ruin more calculator sessions than any other tool: mismatched extents, silent nodata, and expressions that parse beautifully and mean nothing.
- QGIS Rename Field: Alias, In-Place Rename, and Refactor Fields Compared
Renaming a field in QGIS is three different operations wearing one name: an alias that changes only the display, an in-place rename that works only where the data provider allows it, and the Rename Field and Refactor Fields algorithms that write a new layer. This guide compares their permanence, walks each route, and explains the shapefile ten-character limit that truncates names behind your back.
- QGIS Reproject Layer: Change a Layer's CRS Without Breaking Its Geometry
Reprojecting a layer means rewriting its coordinates in a different coordinate reference system, so the same ground gets new numbers. In QGIS the honest tools are the Reproject Layer processing algorithm and the CRS choice inside Export and Save Features As, while the similarly named Assign Projection does something entirely different: it relabels numbers without converting them, and confusing the two is the classic way to teleport a dataset. This guide separates project CRS from layer CRS, walks both real routes, and shows how to verify the result.
- QGIS Rotate Map: Canvas Rotation, Layout Rotation, and the Grid Rules
Rotating a map in QGIS lives in three places that do not talk to each other: the canvas Rotation field in the status bar, the print layout Map item's own Map rotation property, and the grid settings that react when a grid follows rotation. This guide teaches rotation as one system: how each surface works, why the canvas never leaks into the layout, north-arrow synchronization, and the annotation limits a rotated grid imposes.
- QGIS Server: Publish a Desktop Project as WMS, WFS, and WCS Services
QGIS Server turns the same project file you style on the desktop into OGC web services: WMS maps, WFS features, and WCS coverage data, rendered with the desktop's own engine so the web map looks exactly like the printed one. This guide covers the architecture, the FastCGI binary behind Apache or nginx, the OWS Server settings inside the project, capabilities documents, and the discipline of publishing from a project built to be served.
- QGIS Snapping: Enable It, Set the Tolerance, and Make Vertices Meet
Snapping is the invisible magnetism that decides whether your digitized boundaries actually touch: roads that meet at junctions, parcels that share an edge with no gap and no overlap, a new polygon that closes exactly on the corner of the old one. QGIS controls it from the Snapping Toolbar, with the S key as its switch, snap modes for vertices and segments, a tolerance in pixels or map units, and layer scopes from current layer to a full advanced configuration. This guide sets it up properly and explains the companions, tracing, snapping on intersections, and topological editing, that turn snapping from a convenience into clean data.
- QGIS Spatial Join: Join Attributes by Location, Explained With Its Predicates
A spatial join answers the question every GIS user meets in the first month: these points know what happened, those polygons know where it counts, how do the two tables become one? QGIS's Join Attributes by Location does it with geometric predicates, intersects, contains, within, touches, and two join types whose difference silently doubles datasets when chosen carelessly. This guide teaches the tool through its decisions: predicate, join type, the Summary variant for counts and statistics, and Join by Nearest for distance questions, with the row-count checks that prove the join did what you meant.
- QGIS Symbology: Single, Categorized, and Graduated Styles, and the Classification Choice
Symbology is where a QGIS layer becomes a map: one symbol for everything, a symbol per category, or symbols scaled by a number. This guide teaches the three beginner renderers in Layer Properties, then the real subject, the five graduated classification methods, Equal Interval, Quantile, Natural Breaks, Pretty Breaks, and Standard Deviation, and how the same numbers tell different stories under each.
- QGIS Topographic Map: From DEM to a Finished Sheet
Making a topographic map in QGIS is an assembly job: a DEM at the bottom, hypsometric tints blended with a hillshade on multiply, a slope layer where the terrain needs it, contours extracted with an elevation attribute for labels, and a print layout finish. This guide gives the workflow in order, the layer stack and its logic, and the judgments that separate a terrain picture from a topographic sheet.
- QGIS Tutorial for Beginners: Your First Map, Start to Finish
Install QGIS, learn the four parts of its window, and build a complete first map: an OpenStreetMap base, a layer of five famous places from a table printed in this article, labels, a print layout with title, legend, and scale bar, and an exported finished map.
- QGIS Vertex Tool: Move, Add, and Delete Vertices Without Redrawing
The Vertex Tool is QGIS's instrument for reshaping what already exists: grab a vertex and move it, drag a segment by its midpoint to shift a whole edge, click the plus markers to add points where a boundary needs more detail, delete the strays, and type exact coordinates into the Vertex Editor panel when the mouse is not precise enough. This guide covers the tool's two scopes, Current Layer and All Layers, its segment and midpoint behaviors, and the working habits that keep edits surgical instead of destructive.
- QGIS vs ArcGIS: The Free Professional Against the Industry Platform
QGIS is a free, open source, professional GIS that runs on Windows, Mac, and Linux. ArcGIS is Esri's commercial platform, Pro on Windows backed by an ecosystem of licensed extensions and enterprise services. This comparison skips the brochure claims and scores what decides real adoptions: cost structure, operating systems, file and data compatibility, extensions, support, and the jobs each one is genuinely hired for.
- QGIS vs Google Earth: A Viewer and a GIS Are Not the Same Tool
Google Earth and QGIS are both free, both show the planet, and both get recommended for each other's jobs. Earth is a viewer: unmatched imagery, historical photos, and 3D, with almost no analysis. QGIS is a full geographic information system: analysis, editing, databases, and print, with a learning curve. This comparison sorts tasks to the right tool and explains why the two programs disagree when you measure the same field in both.
- QGIS vs GRASS GIS: The Friendly Desktop vs the Analytical Engine
QGIS and GRASS GIS are both free and open source, and they are not really rivals. QGIS is the modern desktop for making maps, editing data, and orchestrating hundreds of tools through its Processing toolbox. GRASS is an analytical engine with more than 400 modules, strongest exactly where QGIS is thinnest: raster analysis, terrain, hydrology, and time series. Better still, GRASS runs inside QGIS. This comparison maps each tool to the work it wins, so you can install both and route each job to its rightful owner.
- QGIS Web Map: Export Your Project to a Self-Contained Web Map with qgis2web
A QGIS web map, in the sense this guide owns, is your own project exported by the qgis2web plugin into static HTML, JavaScript, and CSS: a folder you can drop on any web host, with popups, labels, layer control, and your styling intact, no server required. This guide covers the export system end to end, the Leaflet and OpenLayers choice, the settings that decide quality, and the honest boundary where a static export stops and a server begins.
- QGIS Zonal Statistics: Summarize a Raster by Polygon Zones
Zonal statistics answers the question every raster eventually gets asked: not what the grid says cell by cell, but what it says per place, the mean rainfall of each farm, the highest elevation in each district, the total biomass inside each reserve. The QGIS tool lives in the Processing Toolbox under Raster analysis, takes a raster and a polygon layer, and appends your chosen statistics, count, sum, mean, min, max, spread, to the zone layer itself. This guide runs it properly, with a hand-checkable example, and covers the alignment and interpretation traps that decide whether the numbers mean anything.
- QGIS: How to Georeference an Image, From Scan to GeoTIFF
Georeferencing teaches a dumb picture, a scanned map, an old aerial photo, a floor plan, where it lives on Earth, so QGIS can drape it over real data. The instrument is the Georeferencer, in the Layer menu since QGIS 3.26, and the craft is ground control points: enough of them, spread wide, checked by residuals rather than by hope. This guide walks the full workflow and teaches the lesson a worked 1947 map example makes unforgettable: a zero mean error can still hide a badly placed map, so you verify against points the fit never saw.
- Rule-Based Symbology in QGIS: Styles Written as Conditions
Rule-based symbology is the renderer where a layer's style stops being a lookup and becomes a set of conditions: each rule pairs a filter expression with a symbol, rules nest, an ELSE rule catches the rest, and each rule can carry its own scale range. This guide teaches the renderer end to end: building a worked road and land use style, rule order, nesting, the invisible-feature trap, and saving the result as a reusable QML style.
- Select by Location in QGIS: Pick Features by Where They Sit
Half of all GIS questions are really one question: which of these are inside, touching, or near those? Select by Location is QGIS's answer, a tool that selects features in one layer by their spatial relationship to another layer, using predicates like intersects, within, contains, and touches. This guide teaches the predicates in plain language with the border cases that separate them, shows the selection modes that let you build a selection in stages, and explains what a selection is and is not: it creates nothing, and that is exactly its power.
- Shapefile Viewer: Open a Shapefile Without Desktop GIS
A shapefile viewer opens the format's family of files, the .shp geometry, the .dbf attributes, the .prj projection, in a browser or a light tool, draws the map, and shows the table, with no desktop GIS installed. This guide teaches viewing as its own skill: what a viewer needs to work, the missing-.prj trap and how to diagnose it, and the honest line where a viewer stops and QGIS starts.
- Shapefile vs Geodatabase: The Limits That Decide Which Container Your Data Deserves
The shapefile is a 1990s format that still runs the world's data exchanges, and the file geodatabase is Esri's modern container that removes nearly all of its limits. This comparison is decided by hard numbers: 2 GB component ceilings and 10 character field names against 1 TB datasets and 64 character names, null handling, topology, and multi user editing, ending in a simple rule for which container a given dataset should live in.
- The Humanitarian OpenStreetMap Team: How HOT Turns Volunteers Into Crisis Maps
When an earthquake or flood hits a place the maps forgot, the Humanitarian OpenStreetMap Team (HOT) organizes thousands of volunteers to map it from satellite imagery within hours. This profile covers HOT's founding after the 2010 Haiti earthquake, its tools (Tasking Manager, MapSwipe, OpenAerialMap), its regional hubs, and how its model of remote mapping plus local communities actually works.
- The OpenStreetMap API: What It Is, What It Caps, and What It Is Not For
The OpenStreetMap API is the editing interface of the project: the door through which editors and apps read small pieces of the map and write changes back. It is not a general data download service, and treating it like one is the classic beginner mistake. This guide explains what API version 0.6 actually offers, the caps on its famous map call, how authentication moved to OAuth 2.0, and the map of neighboring services, Overpass, Nominatim, tiles, that own the jobs the API refuses.
- The QGIS Attribute Table: Rows Are Places, Columns Are Facts
Every layer in QGIS is two things at once: the shapes on the map and the table behind them. The attribute table is where the data half lives, and learning to work it, sorting, filtering, selecting, and calculating, is what turns a QGIS user from a map viewer into an analyst. This guide opens the table every way it can be opened, reads it properly, and teaches the moves that answer real questions.
- The QGIS Georeferencer: Pin a Scanned Map to the Real World
A scanned historical map is a picture until you georeference it: teach QGIS a set of ground control points, places whose real coordinates you know, and the Georeferencer stretches the picture until it lies on the Earth correctly, ready to overlay on modern data. This guide walks the whole job: choosing points that spread and hold, picking the transformation that matches your scan's sins, and reading residuals with the skepticism they deserve, because a map can be warped to fit its control points and still be wrong everywhere else.
- The QGIS Python Console: Drive the Whole Application With Code
The Python Console is QGIS's second interface: a live command line into the running application, opened with Ctrl+Alt+P, where the preloaded iface object reaches the canvas, the layers, and every Processing algorithm. This guide teaches the console properly: the session workflow, QgsProject, the built-in editor, processing.run, and startup.py, the ladder from one-off commands to a scripted practice.
- Viewshed Analysis in QGIS: What a Point Can Actually See
A viewshed computes line of sight over a terrain model: from an observer point, at a stated height, which ground is visible and which is hidden by the hills between. In QGIS the work belongs to the Visibility Analysis plugin: create observer points, then run the viewshed, binary or cumulative. This guide teaches the workflow, the projected-CRS rule, observer and target heights, curvature and refraction, and how to read the result without lying with it.
- Watershed Delineation in QGIS: From a DEM to a Basin Boundary
Delineating a watershed in QGIS is a pipeline, not a tool: condition the DEM, compute flow direction and accumulation, choose an outlet, and let the basin draw itself upstream of it. The engines are GRASS (r.fill.dir, r.watershed, r.water.outlet, r.to.vect) and SAGA (Fill sinks Wang and Liu, Catchment Area, Channel Network, Watershed Basins). This guide runs the pipeline end to end, with the metric-CRS rule first and the verification habits that catch a wrong basin before it ships.
- What Is a Mapathon? Mapping Parties That Fill In the World
A mapathon is a coordinated volunteer event where people trace buildings and roads from satellite imagery into OpenStreetMap, usually for places facing floods, disease, or disaster. What actually happens hour by hour, the two skill levels, and how to join one with no experience.
- What Is a Shapefile? The Four Files, the Famous Limits, and When to Retire It
A shapefile is not a file. It is a small family of files that must travel together: .shp for the geometry, .shx for the index, .dbf for the attributes, and .prj for the coordinate system. Lose one and the data breaks in a different way each time. This guide explains what each component does, the format's famous limits from the 1990s, 2 GB ceilings and 10 character field names, and the modern formats that replace it.
- What Is GIS
GIS is the system behind smart maps: layers of location data that answer questions about places. Learn how it works, where it is used, and how to make your first map free.
- What Is GIS Data? The Two Halves of Every Map Layer, Explained for Beginners
GIS data is the information a geographic information system actually works with, and every piece of it has two halves: geometry, where the thing is, and attributes, what the thing is. It comes in two great families, vector data built from points, lines, and polygons, and raster data built from grids of cells like imagery and elevation. This guide explains both families with their everyday examples, shows how layers stack because they share a coordinate system, names where the data comes from, and ends with the honesty note every beginner deserves: GIS data is generalized, planning grade information, not a legal survey.
- What Is GIS Mapping? Turning Layered Data Into a Map That Answers a Question
GIS mapping is the practice of building maps from layered geographic data so the map answers a question: where are the cases clustering, which parcels flood, where should the next clinic go. It runs a five step pipeline, capture, store, query, analyze, present, and it differs from a plain map in one essential way: every layer stays connected to the data beneath it, so the map can be re-asked. This guide explains the pipeline, the anatomy of a GIS map, and gives you a first mapping exercise you can finish today.
- What Is GIS Software? The Six Categories, From Desktop GIS to Spatial Databases
GIS software is any software that stores, analyzes, or presents geographic data, and it comes in six working categories: desktop GIS like QGIS and ArcGIS, web and cloud GIS, server and enterprise systems, mobile field apps, spatial databases such as PostGIS and SpatiaLite, and the developer libraries and platforms, Leaflet, Mapbox, GDAL, GeoPandas, underneath them all. This guide defines the field, walks each category with its exemplars, and ends with a choose by task table so any tool you meet can be classified on sight.
- What Is QGIS? The Free GIS Program, Explained for Beginners
People keep telling you to "just open it in QGIS", and you keep nodding while wondering what QGIS is, whether it is really free, and whether it is meant for someone like you. This explainer answers in plain language: what QGIS does, where it came from, what it costs and what the license lets you do, how it compares with ArcGIS and Google Earth Pro, and the honest list of things it will not do for you.