GIS for Beginners: A Friendly Path From Zero to Your First Map
By the Osm4People editorial team
Photo: Tatiana Syrikova / Pexels
GIS, geographic information systems, sounds like a profession and behaves like a hobby anyone can start tonight. You already use its consumer end every day: the map app on your phone is a GIS wearing a friendly face, storing places as data and answering questions about them. Learning GIS means stepping behind that face: working with the data yourself, stacking it in layers, asking it questions, and making maps that show your answers. This article is the path: the four ideas in the order to learn them, the free toolkit, where free data lives, and three starter projects in rising difficulty.
If you want the definition first, what is GIS is this site's explainer. This article assumes the definition and answers the next question: what do I actually do, in what order, starting tonight? The Coordinate Explorer on this page is your first step disguised as a toy: every click returns a stored record, a position in four formats, and layers of such records are all a GIS is.
Interactive map
Coordinate Explorer: Your First Data Record
Every click here is one record in a geographic dataset: a position stored in four formats at once. Layers of records like this are all a GIS really is, and this is your first one.
Decimal degrees40.689167, -74.044444
Latitude40.689167° N
Longitude74.044444° W
Degrees minutes seconds40° 41' 21.00" N, 74° 02' 40.00" W
Degrees decimal minutes40° 41.350' N, 74° 02.667' W
You start further along than you think. You can read a map, you have searched for places, and you have probably dropped a pin and shared it. Those acts contain the seeds of the whole discipline: a place became data (the pin), the data traveled (the share), and a map answered a question (what is near it). GIS formalizes three habits you already have: recording positions precisely, which our how to find coordinates on a map guide teaches; organizing places into sets; and asking what is where, and what is near what. The new material is real but modest: a program, a file discipline, and a small vocabulary.
The Four Ideas, in the Order to Learn Them
Idea one: layers. A GIS map is a stack of transparent sheets, each holding one kind of thing: roads on one, buildings on another, rivers on a third. You show, hide, style, and combine sheets to answer questions. This is the master idea; everything else serves it.
Idea two: attributes. Every feature on a layer carries a row in a table: the building's name, the road's type, the river's length. Maps in a GIS are tables drawn, and the table is where questions get asked: show only the roads wider than this, color the buildings by their use.
Idea three: vector and raster. Vector data is geometry, points, lines, and polygons with coordinates, crisp at every zoom. Raster data is a grid of pictures, satellite images and elevation models, where each cell holds a value. Most beginner work is vector; raster arrives with imagery and terrain.
Idea four: the coordinate reference system. Every dataset's numbers obey a rulebook that says what they mean, and stacking two datasets with different rulebooks without telling the software is how maps land in oceans. Learn to ask one question of every file, what system are these numbers in, and you have learned the idea at the depth a beginner needs. Our QGIS tutorial for beginners makes you practice it at the exact step where it matters.
The Free Toolkit Decision
You need one program, and the beginner answer is not close.
Tool
Cost
Learn it when
QGIS
Free, open source, Windows Mac Linux
First. It is the standard free GIS and the one this site teaches
ArcGIS Online
Free tier, paid for depth
If your school or employer lives in the Esri world
Google Earth Pro
Free
For looking, measuring, and simple marks; a viewer more than a GIS
OpenStreetMap editing (iD editor)
Free, in the browser
Alongside everything; it teaches data by making it
Install QGIS, the long-term release, and resist collecting more software. A second program learned too early teaches nothing but the difference between two interfaces. The depth is in the data and the questions, not the buttons.
Where Free Data Lives
GIS runs on data, and the beginner's fear is that data costs money. For learning, the world is free. OpenStreetMap's entire database downloads for any area, which how to download OpenStreetMap data walks through route by route: it is the single richest free dataset a beginner can touch, covering roads, buildings, paths, water, and land use for the whole planet. Governments publish open data portals at every level, from national mapping agencies to city halls giving away everything from tree inventories to bus routes; the quality varies and the CRS question from idea four applies to every file. And the third source is you: a spreadsheet of places with coordinates is a dataset, and making your own is a project below.
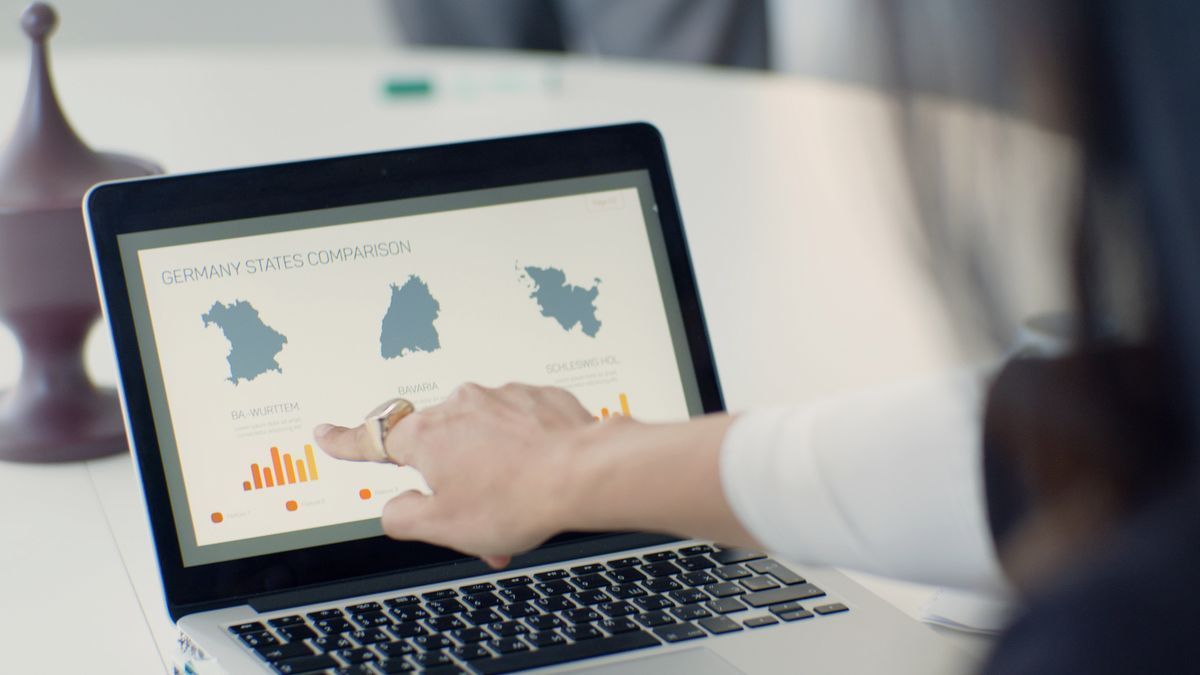
A woman points at data on a laptop screen at a desk
Three Starter Projects, in Rising Difficulty
Project one: the five-place map (one evening). Follow the QGIS tutorial on this site and plot five famous places from a table printed in the article. You will touch layers, attributes, styling, labels, and the print layout in one sitting, and finish holding an exported map. This is the foundation; do not skip it for being small.
Project two: your own week, mapped (one weekend). List ten places from your own life: home, work, the school gate, the good bakery, the trailhead. Find each one's coordinates with the finding guide, type them into a spreadsheet with a column for the category and one for a note, save as CSV, and plot them in QGIS over your town's basemap. Style the points by category. You have just built a personal geographic database, and the questions start asking themselves: which of these are walkable from each other, and what does the pattern of your week actually look like from above?
Project three: your town, one theme (two or three evenings). Download your town's OpenStreetMap data, open it in QGIS, and make a map of one theme you care about: every park, every cycle path, every cafe within a walk of the station. Filter one layer by its attributes, style it with restraint, add the furniture of a finished map, title, legend, scale bar, north arrow, attribution, and export it. Print it. A printed map of your own town, made by you, from real data, is the moment GIS stops being a topic and becomes a capability.
The Traps That Waste Beginners' Time
Three traps eat more beginner months than all real difficulties combined. Projection depth: the mathematics of flattening the Earth matters eventually and almost never in your first season; use the defaults, learn the CRS question, and move on. Scripting first: Python and spatial SQL are powerful and genuinely useful later; learned before you can make a map by hand, they automate confusion. Make ten maps with your mouse first. Course collecting: three half-finished courses teach less than one finished project; the projects above are deliberately completable, because a finished small map teaches the loop that every bigger map repeats. A fourth trap deserves its own sentence: waiting for the perfect dataset. The dataset you have, plotted tonight, beats the perfect one you will download someday, because skill compounds and someday does not.
What to Skip For Now, Without Guilt
Skip projections beyond the one question. Skip paid software entirely. Skip 3D, animation, and web mapping until your flat printed maps bore you. Skip the advanced statistics. The discipline of GIS is wide, and the beginner's edge is narrowness: layers, attributes, one program, real data, finished maps. Everything skipped here has a season, and you will know its season has come when a project you care about refuses to be finished without it. That refusal, not a syllabus, is the correct enrollment form for every advanced topic.
Your First Month, Week by Week
Week one: install QGIS and finish project one, the five-place map, following the tutorial step by step. Expect the ocean trap or the CRS question to bite once; both are tuition, and both are cheaper in week one than in a job. Week two: project two, your own week mapped, which teaches data creation, the skill no download can give you. Spend the leftover evenings editing OpenStreetMap itself, adding the places near you that the map is missing, because editing teaches data structure from the inside like nothing else. Week three: project three, your town on one theme, downloaded and filtered and printed. Week four: repeat any project with better taste: restyle a map until a stranger could read it at arm's length, and learn the one new feature each finished map demands, a buffer, a filter, a join, in the order your curiosity files them. At the month's end you will not be a GIS professional, but you will be something rarer than a course graduate: a person who has finished four real maps and can start a fifth without instructions. Every advanced topic in the field is now a door you can open on demand, including the collaborative ones: the volunteers in our mapathon article are, most of them, people who walked exactly this path and then wanted company.
Related Guides
This guide does not stand alone. The GIS and open map data guides below take up the questions it leads into:
About a month of evenings to reach honest competence: making layered maps from real data, styled and exported properly. The four ideas take a weekend to grasp; the fluency comes from the projects, and the three in this article are sized to fit that month.
Do I need a geography or computer science degree?
No. GIS is used by planners, ecologists, journalists, historians, logistics managers, and hobbyists, most of whom learned it as a tool inside their own field. The mathematics required at beginner level is the coordinate arithmetic this site teaches in its coordinates pillar.
Is QGIS good enough, or will I need ArcGIS?
QGIS is a full professional GIS used by governments and firms worldwide; it is not a training-wheels product. ArcGIS matters where an employer or institution is standardized on it. Learn the concepts in QGIS and the transfer later is mostly vocabulary.
Where do I get data to practice on?
OpenStreetMap downloads for any area on Earth, free, through the routes in our download guide. Your own spreadsheet of places is the second source, and government open data portals are the third. Data scarcity is not a problem beginners actually have.
Should I learn to code for GIS?
Eventually, if your projects grow: Python multiplies what QGIS can do. But code after maps, not before. Ten finished maps teach you what is worth automating; automating first teaches you to generate unfinished maps faster.
What is the difference between GIS and making maps?
Mapmaking, cartography, is the communication end: styling and layout so a reader understands. GIS is the whole system: storing, layering, querying, and analyzing geographic data, of which making the final map is the last step. This path teaches GIS with cartography riding along, because a map is how every analysis gets judged.
Photo credits: Tatiana Syrikova (Pexels); Kampus Production (Pexels). Photos are served from this site; follow the credit to the library page for the original.