A plain map is a picture of geography. A GIS map is a question asked of geography, with the answer drawn. GIS mapping is the practice of assembling geographic data into layers inside a geographic information system, then querying and analyzing those layers so the resulting map shows not just where things are, but what the arrangement means: which neighborhoods sit inside the flood zone, where disease cases cluster against the water pumps, which roads carry the traffic the new depot must serve. The map is the output; the mapping is the thinking. This guide explains that thinking as a five step pipeline you can apply to any project, dissects what a GIS map contains that a plain map does not, and ends with a worked exercise. If you are choosing the learning path itself, gis for beginners is the roadmap; if you want the data types under the layers, what is gis data is the companion. This page owns the practice: how a GIS map gets made and why it persuades.
Home / GIS and Open Map Data for Beginners
What Is GIS Mapping? Turning Layered Data Into a Map That Answers a Question
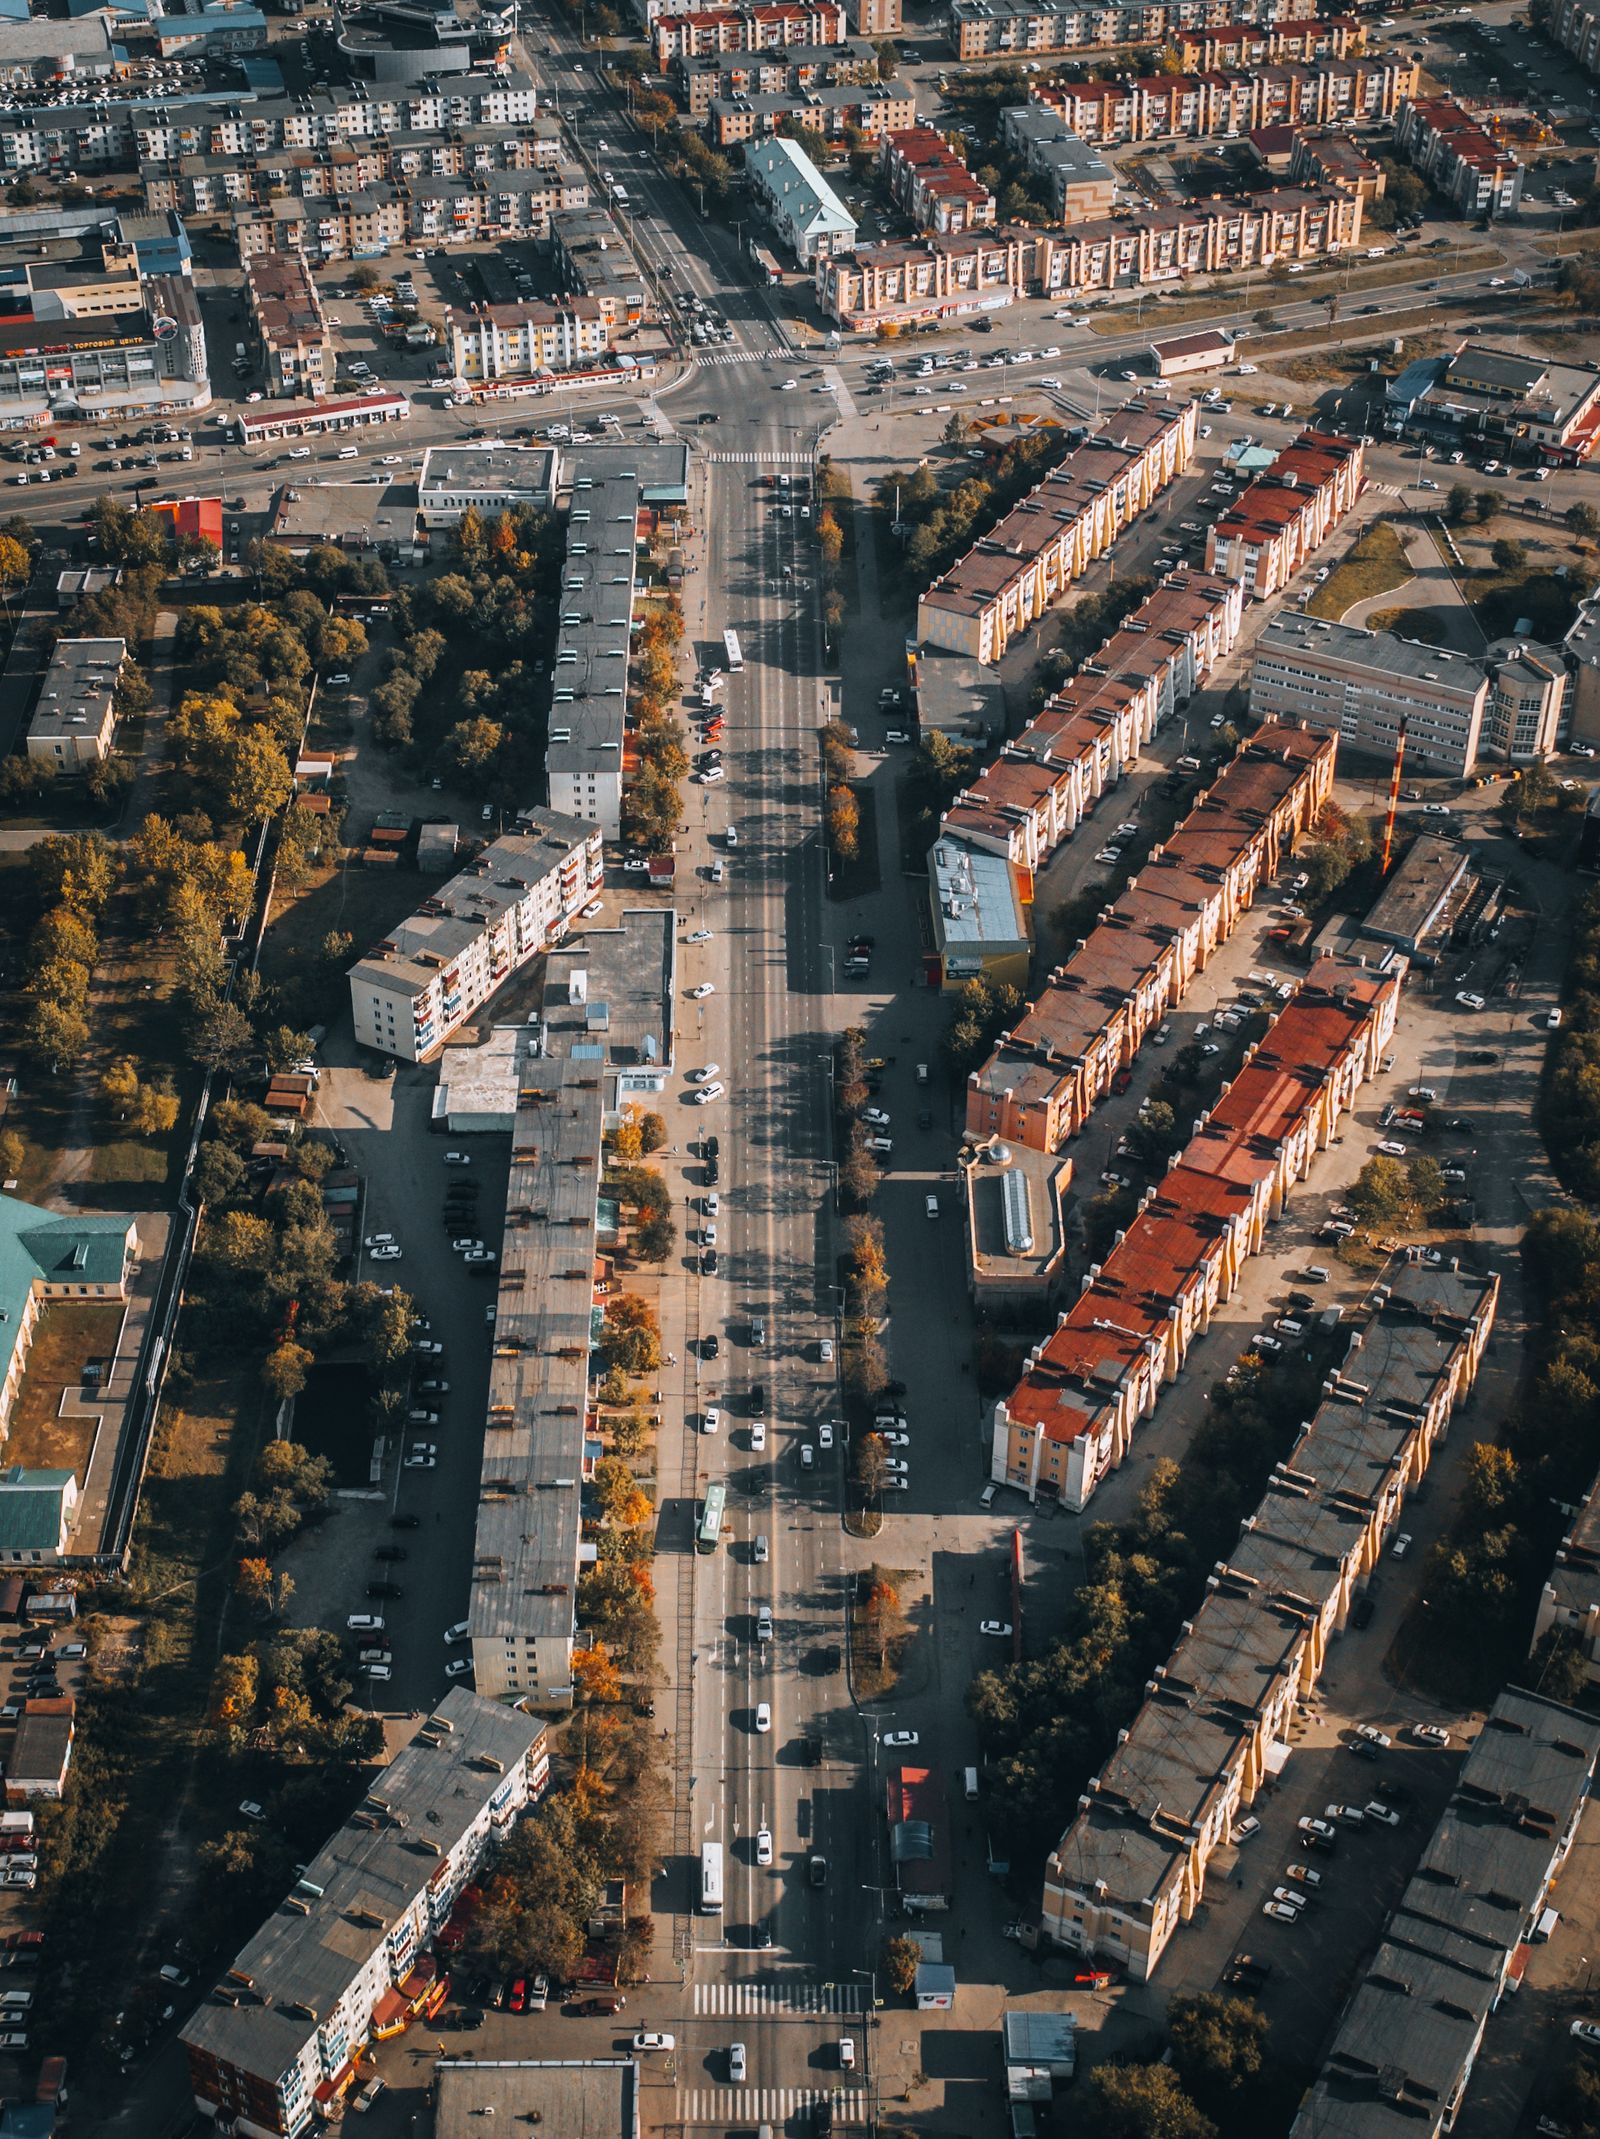
Photo: Michael Kanivetsky / Pexels
Coordinate Explorer: One Layer of the Stack
Every click returns a record: a geometry and the facts attached to it. Stack records like this in layers, query them, and draw the answer, and you are doing the GIS mapping this article pipelines.
Map data © OpenStreetMap contributors. Coordinates are read from the map itself, in the WGS 84 system your phone uses.
The Five Step Pipeline
Every GIS mapping project, from a student exercise to a national atlas, runs the same five steps. One, capture: get data into the system, by downloading open data, digitizing from imagery, importing GPS tracks and survey points, or geocoding address tables into points. Two, store: organize the data in layers with a shared coordinate system, clean attributes, and sensible file or database homes, because analysis on messy storage produces confident nonsense. Three, query: select by attribute and by location ("parcels where zoning equals residential" and "within 100 meters of the river"), the two questions every dataset must answer before analysis begins. Four, analyze: compute something new, buffers around hazards, overlays intersecting flood zones with buildings, density surfaces from point clusters, routes along networks. Five, present: compose the map that carries the answer, with a title that states the finding, a legend that respects the reader, and scale and attribution in place. Beginners obsess over step five because it is visible; professionals know projects are won at steps one and two, where the data's fitness is decided. The pipeline is also a diagnostic: when a GIS map disappoints, walk the steps backwards and the weak one identifies itself.
The Founding Example: A Map That Solved an Outbreak
GIS mapping has a creation story every student learns, because it contains the whole method in miniature. In 1854, during a London cholera outbreak, physician John Snow plotted the deaths as marks at their addresses on a street map, layered in the positions of the neighborhood's water pumps. The cluster of deaths around the Broad Street pump was the analysis made visible: the map did not merely display the outbreak, it identified the source, and the pump handle's removal became the most famous act of spatial analysis in history. A century later the practice got its machinery: in the 1960s, Roger Tomlinson led the creation of the Canada Geographic Information System, built to inventory the country's land resources, and in doing so formalized the layer model, computerized overlay, and the very term GIS. Snow supplied the idea (layer the evidence, let the pattern accuse), Tomlinson supplied the system (store layers digitally, compute with them), and every GIS map since is their collaboration. Notice what neither did: neither made a prettier street map. The value was never the cartography alone; it was the question the layers could answer together.

Anatomy: What a GIS Map Contains That a Plain Map Does Not
Open a GIS map's project and you find its secrets exposed: a stack of layers, each a dataset with geometry and an attribute table, all registered to a shared coordinate system so they align. A road layer knows each segment's name, class, and speed limit; a parcel layer knows owners and zoning; a points layer of clinics knows beds and staffing. The map on screen is a view computed from that stack: change a query and the view changes, hide a layer and the argument changes, restyle by an attribute and a new pattern surfaces. This is the essential difference from a plain map, even a beautiful digital one: a plain map's features are ink, while a GIS map's features are records, each one selectable, countable, and connected to the data that describes it. It is also why GIS mapping scales from a village project to a national infrastructure: the same record based model holds a dozen layers or ten thousand, and the analysis verbs (select, buffer, overlay, join) work identically at both scales. The file formats carrying those records, shapefiles, GeoJSON, GeoPackages, are compared in geojson vs shapefile for when your own stack begins.
The Analysis Verbs, in Plain Terms
Four verbs do most of GIS mapping's work, and each answers a family of questions. Buffer: draw a zone at a fixed distance around features (500 meters around a proposed site, 100 meters along a river) to ask what falls inside the influence or the risk. Overlay: intersect two layers so attributes combine (parcels crossed with flood zones yields parcels at risk, with both data sets' facts attached). Spatial join: attach the facts of one layer to another by location (each clinic gains the population of the district containing it), the workhorse of planning reports. Density and interpolation: turn scattered points into a continuous surface (case density, rainfall between gauges) so patterns between the measurements become visible. None of these require mathematics beyond arithmetic to understand, and all of them are one menu item deep in free software like QGIS. The craft is not in running them; it is in choosing the verb that matches the question and the distances and thresholds that match the real world process, because a buffer of the wrong radius is a wrong answer with excellent graphics.
Map One Question: Your First Exercise
Theory sets in when hands move, so here is the exercise this guide exists to deliver. Pick one question with a where in it that you genuinely care about: which streets in my town flood, where are the bike crashes, which parks serve which neighborhoods. Gather two or three layers only from open data (your city or national open data portal, or OpenStreetMap extracts): the base geography, the phenomenon, and the thing it affects. Load them into QGIS (free; our qgis tutorial for beginners gets you running), align them in one project, and apply one verb: buffer the river and count the buildings inside, or join the crashes to the streets and rank them. Then present it honestly: a title that is a claim ("Twelve percent of homes in the study area sit within the 100 meter river buffer"), a legend, a scale bar, and the data sources credited. You have now done GIS mapping, all five steps, and the next project is the same pipeline with more layers and a sharper question. Readers who want project sized versions of this exercise will find them in gis projects for beginners.
Where GIS Mapping Earns Its Keep
The pipeline pays rent in any field where the decision has a geography. Public health runs Snow's play at modern scale, mapping cases against environment to aim interventions. Utilities and infrastructure map assets, outages, and demand to decide where crews and capital go. Retail and logistics map customers, competitors, and drive times to place stores and depots where the map says the market actually is. Conservation and agriculture map habitat, soils, and yields to spend scarce effort on the hectares that matter. In each field the pattern repeats: the questions were always spatial, the data existed in tables that hid the pattern, and the GIS map was the moment the pattern became arguable in a meeting. That is the practical definition to carry away: GIS mapping is the discipline of making spatial patterns visible enough to act on, and its software, from QGIS to the largest enterprise stack in what is gis software, exists to serve that moment.
GIS Map vs Plain Map, Settled
A plain map answers "where is it" for a reader. A GIS map answers "what does the arrangement mean" for a decision, and it can be re-asked when the decision changes, because its layers remain alive underneath. Both are honorable products; a trailhead kiosk needs the first, a planning department needs the second, and confusing them wastes effort in both directions (analyzing what only needed drawing, or drawing what needed analyzing). When someone asks what GIS mapping is, the shortest true answer is this: it is mapmaking where the map is the visible tip of a database, and the mapping is the discipline of capture, storage, query, analysis, and presentation that makes the tip worth trusting.
Related Guides
Readers working through this topic usually need its closest companions too. These GIS and open map data guides cover the neighboring ground:
- Shapefile vs Geodatabase: The Limits That Decide Which Container Your Data Deserves: The shapefile is a 1990s format that still runs the world's data exchanges, and the file geodatabase is Esri's modern container that removes...
- National Map Data Download: The USGS Doors, and Which One Your Data Lives Behind: The National Map is not one download page but a family of USGS services, and most failed downloads are really a wrong door: the main Download...
- How to Use OpenStreetMap in Flutter: flutter_map, Tiles, Markers, and Search: Flutter has no official Google style map from the OpenStreetMap world, but the community package flutter_map gives you a full OSM map widget in...
Frequently Asked Questions
What is GIS mapping in simple words?
It is making maps inside a geographic information system, where geographic data is stored in layers connected to attribute tables, so the map can answer questions: what is inside this zone, where do cases cluster, which sites qualify. A GIS map is a view of data, not just a picture of places.
What are the five steps of GIS mapping?
Capture the data, store it in clean aligned layers, query it by attributes and location, analyze it with operations like buffers and overlays, and present the result as a composed map. Every project runs these steps, and weak results usually trace back to the capture or storage steps.
How is a GIS map different from a normal map?
A normal map's features are fixed ink. A GIS map's features are records in a database, each carrying attributes, so the map can be queried, restyled by data, and recomputed when the question changes. The printed outputs can look identical; the difference is what lives underneath.
What is the most famous early example of GIS mapping?
John Snow's 1854 London cholera map, which plotted deaths by address against water pump locations and revealed the Broad Street pump as the source. The first true GIS followed in the 1960s, when Roger Tomlinson's Canada Geographic Information System computerized the layer and overlay model.
What software do I need to start GIS mapping?
Free software is enough: QGIS for desktop mapping and analysis, with data from open data portals and OpenStreetMap. The five step pipeline and the core analysis verbs (buffer, overlay, spatial join, density) are all available without any license cost.
Photo credits: Michael Kanivetsky (Pexels); ThisIsEngineering (Pexels). Photos are served from this site; follow the credit to the library page for the original.