Ask what GIS is and you get a description of software and a profession; our what is GIS guide gives that tour. Ask what GIS data is and you get to the substance the software eats: the digital record of where things are and what they are like, organized so a computer can map it, measure it, and answer questions about it. Every dataset in every GIS, from a national road network to a spreadsheet of wells a charity drilled, is built from the same few ideas. Learn them and the whole field's vocabulary unlocks: vector and raster, features and attributes, layers and coordinate systems. This guide teaches those ideas in working order, with the examples a beginner actually meets, and it closes with the caveat that separates informed users from confident ones. If you are starting the skill itself, GIS for beginners is the on ramp; this page is the anatomy lesson underneath it.
Home / GIS and Open Map Data for Beginners
What Is GIS Data? The Two Halves of Every Map Layer, Explained for Beginners
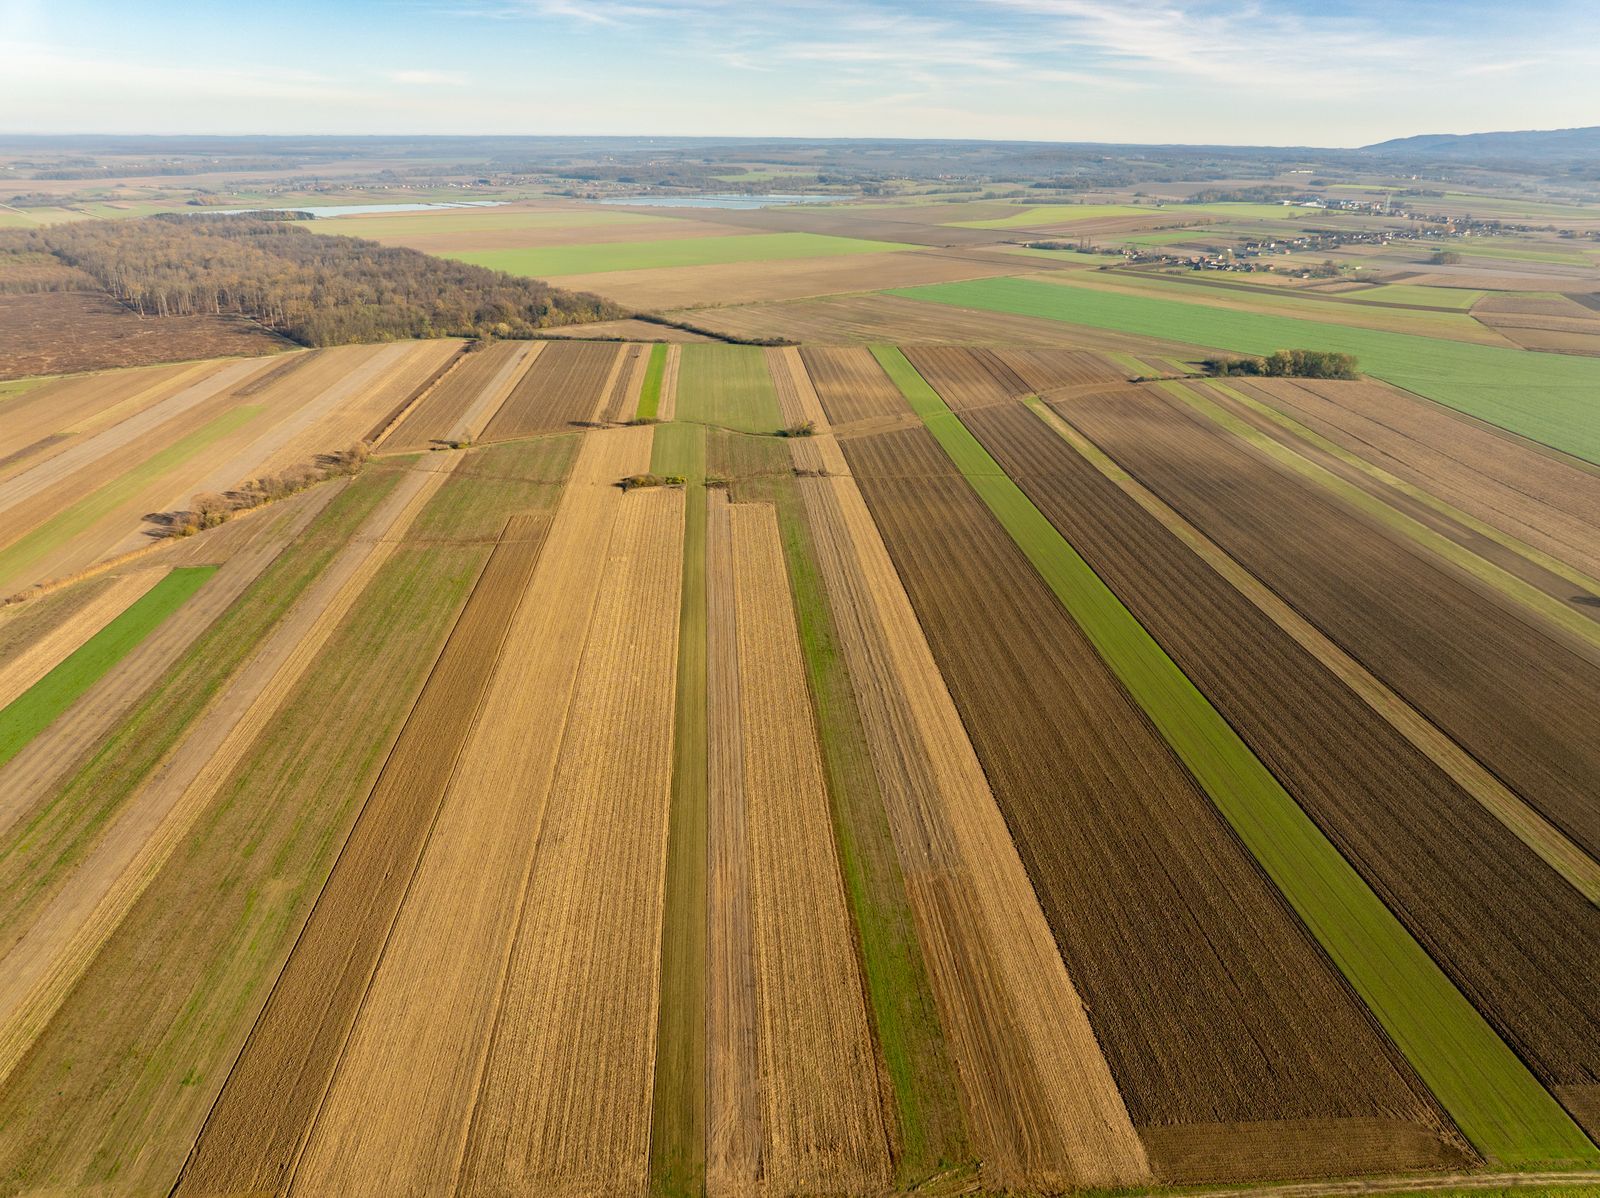
Photo: Vladimir Srajber / Pexels
Coordinate Explorer: A Feature Is a Pair Plus a Row
Click a place and read its pair. In GIS terms that pair is the geometry; the attribute table row describing the place is the other half of the feature this article takes apart.
Map data © OpenStreetMap contributors. Coordinates are read from the map itself, in the WGS 84 system your phone uses.
The Two Halves: Geometry and Attributes
Every record in GIS data, called a feature, joins two halves. The geometry is the feature's shape and position on the Earth: a point, a line, a polygon, or a cell in a grid, located by coordinates in a declared coordinate system. The attributes are everything else known about the thing, stored as a row in a table: the road's name, surface, and speed limit; the well's depth, year drilled, and condition; the parcel's owner category and area. Neither half is useful alone at scale. Geometry without attributes is a drawing; attributes without geometry are a spreadsheet. GIS begins where they are joined, because the join is what lets you ask the field's characteristic questions, which are always half spatial and half descriptive: show me (geometry) all wells (attributes) drilled before 2010 that are within a kilometer of a school. Click the tool above and read a point's pair: that pair is a geometry looking for its attribute row, which is the most compact definition of GIS data there is.
Family One: Vector Data, Points, Lines, and Polygons
Vector data represents discrete things with geometric primitives. Points mark things small enough, at the map's scale, to be locations: wells, trees, bus stops, address locations, the nodes of OpenStreetMap. Lines (and their multi part cousins) carry things that run: roads, rivers, pipelines, flight paths, hiking trails. Polygons enclose things with area: buildings, lakes, land parcels, city boundaries, forest stands. The choice among them is a modeling decision, not a property of the world: a city is a point on a national map, a polygon on a regional one, and a universe of all three on its own planning maps. Scale decides, and the same dataset at the wrong scale misleads politely. Vector data's strengths are precision, compactness, and rich attributes; its file formats are the field's household names, the shapefile (our guide explains its multi file anatomy), GeoJSON for the web (coordinates always WGS84, per our GeoJSON guide), and GeoPackage for modern single file work. The comparison of the two web era formats is in GeoJSON vs shapefile.
Family Two: Raster Data, Grids of Cells
Raster data represents continuous surfaces as a grid of cells, each cell holding a value. The familiar example is imagery: satellite and aerial photographs are rasters whose cell values encode color. The analytical examples matter more. An elevation raster (a digital elevation model) holds a height in every cell, from which slope, watershed, and viewshed are computed; our how to read an elevation map guide teaches the human version of reading that surface. Land cover rasters hold a category per cell: forest, water, urban, crop. Climate and environmental rasters hold rainfall, temperature, pollution, or probability per cell. A raster's resolution, the ground size of one cell, is its honesty label: a 30 meter elevation grid (the class of the widely used Copernicus GLO-30 data) cannot see a ditch, and a 10 meter land cover grid cannot see a single tree. Rasters and vectors convert into each other imperfectly and constantly, and knowing which family a question belongs to, discrete things or continuous surfaces, is the beginner's most valuable instinct.
Layers: How the Halves Become a System
GIS work is organized in layers: all the roads in one dataset, all the wells in another, the elevation raster beneath both. Layers stack usefully because they share a coordinate system, the agreed mathematical frame that lets a coordinate pair in one layer mean the same ground as the same pair in another. When layers refuse to align, the cause is almost always a coordinate system mismatch or a datum difference, the detective work of our how to find a coordinate system guide. The layer model is what makes the characteristic questions answerable: overlay the wells layer on the land cover raster and the school layer, and proximity analysis, buffers, and joins do the rest. It is also what makes data quality a system property: a perfect roads layer over a misregistered imagery layer produces confidently wrong measurements, which is why professionals record each layer's source, date, scale, and coordinate system as metadata, the dataset's papers, and check them before trusting a result.
Where GIS Data Comes From
Four sources supply nearly everything. Field collection: GPS receivers, survey instruments, and phone apps recording positions and attributes on the ground, the most accurate and most expensive source per feature. Remote sensing: satellites and aircraft producing imagery and elevation rasters, interpreted by humans and algorithms into land cover and change maps. Digitizing and conversion: paper maps, engineering drawings, and address records converted into features, the source of most parcel and utility data. Open and public data: government portals publishing roads, boundaries, census geography, and environmental layers, and the volunteer commons of OpenStreetMap, whose data model and use routes fill our how to use OpenStreetMap data guide. Every dataset you will ever download is a blend of these, with a vintage: the roads from a 2023 aerial survey, the wells from a 2019 field campaign. Asking a dataset its source and date is not pedantry. It is how you learn what its numbers are worth, the same provenance habit this site teaches for single coordinates.
A Worked Miniature: One Dataset, End to End
Make it concrete with the kind of dataset a beginner actually builds: wells drilled by a water charity across one district. The vector layer is points, one per well. Each point's geometry is a single coordinate pair, captured by a phone GPS in the field. Each point's attribute row carries the working facts: an ID, the village name, the year drilled, the depth in meters, the pump type, and the condition at last inspection. Now the characteristic GIS questions become sentences you can almost type. Show the wells drilled before 2015 whose condition is poor: a filter on two attribute columns, no geography at all yet. Of those, which are more than 2 km from the nearest school?: now the geometry works, measuring each candidate against a second layer of school points. Which village should the repair team visit first?: the intersection of the two answers, ranked by the population attribute on a third layer, the villages. Nothing in that workflow is exotic; it is the daily bread of NGOs, utilities, and planning offices, and every step used only the ideas in this article: features, geometry, attributes, layers sharing a coordinate system, and questions that are half where and half what.
The Honesty Note: Planning Grade, Not Survey Grade
End with the caveat that keeps beginners out of trouble. GIS data is generalized: features are simplified for their intended scale, positions carry the error of their source method (a consumer GPS point is meters grade; a digitized boundary inherits the paper map's wobble), and attributes age from the day of collection. Consequently, GIS data is planning grade information. It answers where things are approximately, what is near what, how patterns distribute, superbly well. It does not establish legal boundaries: the parcel line in a county GIS is a representation for assessment and planning, and the legal line is the surveyor's, recorded in deeds and monuments. The professional habit is to state fitness plainly: this data supports this decision at this scale. Carry that sentence into every project, starting with the beginner projects in GIS projects for beginners, and your work will be trusted for the right reason: it knows what it is.
Related Guides
This guide does not stand alone. The GIS and open map data guides below take up the questions it leads into:
- What Is GIS Mapping? Turning Layered Data Into a Map That Answers a Question: GIS mapping is the practice of building maps from layered geographic data so the map answers a question: where are the cases clustering, which...
- OpenStreetMap (OSM): The Wikipedia of Maps, Explained for Beginners: OpenStreetMap is a map of the whole world drawn by its users and free for anyone to use.
- What Is GIS Software? The Six Categories, From Desktop GIS to Spatial Databases: GIS software is any software that stores, analyzes, or presents geographic data, and it comes in six working categories: desktop GIS like QGIS and...
Frequently Asked Questions
What is GIS data in simple terms?
It is digital information about places, where every record has two joined halves: geometry, the thing's position and shape expressed in coordinates, and attributes, a table row describing the thing. Roads, wells, parcels, elevation grids, and satellite imagery are all GIS data when they carry both halves in a known coordinate system.
What is the difference between vector and raster data?
Vector data represents discrete things with points, lines, and polygons plus attribute tables: a road as a line with a name and speed limit. Raster data represents continuous surfaces as grids of cells, each holding a value: imagery, elevation, land cover, rainfall. Choose vectors for things and rasters for surfaces.
What is a layer in GIS?
A layer is one themed dataset in a stack: all roads, all wells, the elevation raster. Layers align because they share a coordinate system, which lets you overlay them and ask combined questions, like which wells lie within a kilometer of a school. Misaligned layers almost always mean a coordinate system or datum mismatch.
Where does GIS data come from?
Mainly four sources: field collection with GPS and surveys, remote sensing from satellites and aircraft, digitizing of paper records and drawings, and open or public releases, including government portals and the OpenStreetMap commons. Every dataset has a blend and a vintage, and both belong in its metadata.
Can I use GIS data to settle a property boundary?
No. GIS parcel lines are generalized representations for planning and assessment, not legal surveys. They are excellent for orientation and approximate measurement, but a boundary dispute or a fence line is settled by a licensed surveyor working from deeds and ground monuments, not by a GIS layer.
Photo credits: Vladimir Srajber (Pexels); Nikola Tomašić (Pexels). Photos are served from this site; follow the credit to the library page for the original.