Stand on a summit and the land performs a simple trick: some of it you can see, and the rest, sometimes a valley two fields away, is hidden by a shoulder of the hill you are standing on. A viewshed is that trick, computed. Given a terrain model and an observer, the analysis walks sight lines outward in every direction and marks each cell of ground visible or hidden, producing the map of what a point can actually see. It is one of the oldest questions in landscape work, asked by lighthouse keepers, fire lookouts, wind farm planners, archaeologists, and anyone siting a tower or a bench, and in QGIS it has a dedicated instrument: the Visibility Analysis plugin. This guide teaches the workflow and, just as carefully, the reading of its results.
Home / GIS and Open Map Data for Beginners
Viewshed Analysis in QGIS: What a Point Can Actually See
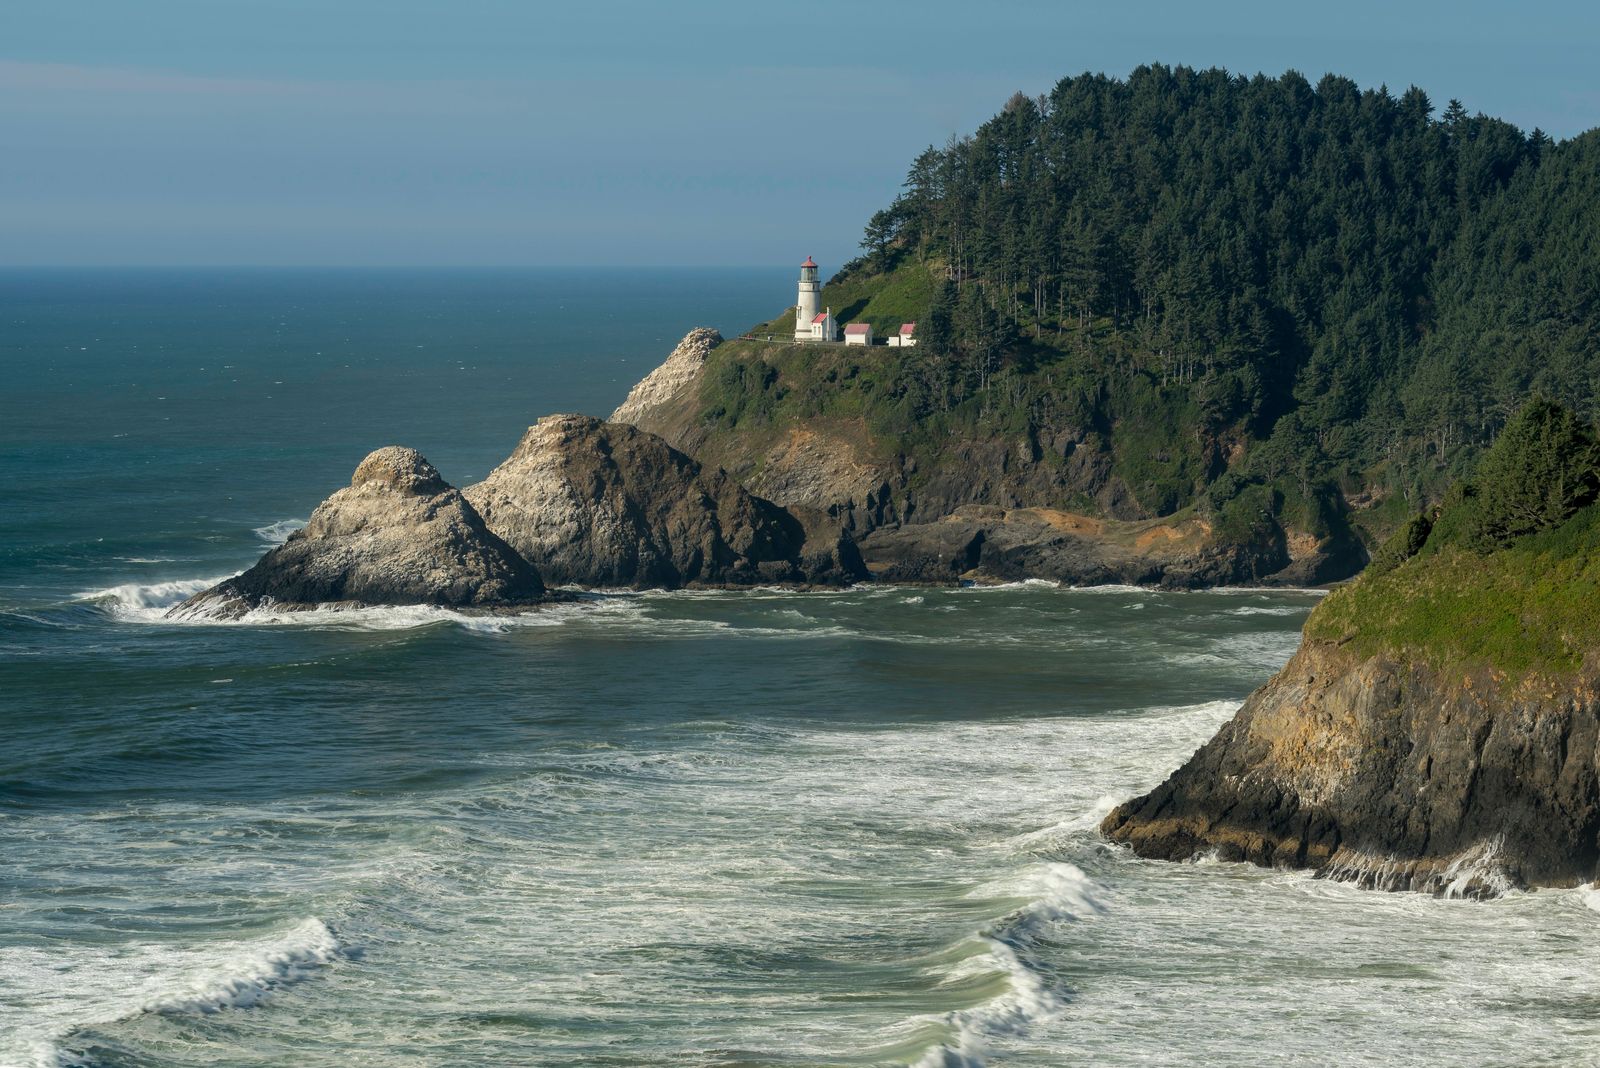
Photo: John Webb / Pexels
Can You See It From Here: The Viewshed Checklist
Check off each step as you finish it. Your progress stays on this page.
0 of 7 complete
0% done
The Instrument: The Visibility Analysis Plugin
QGIS's viewshed capability lives in a plugin by Zoran Cuckovic, installed through the plugin manager in the usual way (our plugins guide covers installation discipline). The plugin's workflow has two deliberate steps, and the separation is the first thing to understand:
- Create observer points: a tool that takes your chosen viewpoint locations and builds the observer layer the analysis needs, stamping each point with the parameters the viewshed will use.
- Viewshed: the analysis itself, run on a DEM with an observer layer, producing the visibility raster.
The two-step shape exists because an observer is more than a point: it is a point plus a height above the ground, a search radius, and, for cumulative work, an identity among many observers. Building observers as their own layer makes the assumptions visible and editable, which is the plugin's quiet virtue: the parameters of a sight line are data, not dialog settings you clicked past.
The Rule Before All Rules: Project the DEM
The standing trap, stated first because it ruins more first attempts than everything else combined: the DEM must be in a projected coordinate system, meters on the ground, never raw latitude and longitude degrees. Sight-line geometry is distance geometry; in a degrees layer, a cell is not square, a radius is not a radius, and the plugin's results bend with the latitude in ways that look plausible and are wrong. Reproject the DEM to the local projected CRS before anything else (our reprojecting guide covers the mechanics), and set the observer layer in the same CRS. Every other parameter in this guide assumes that foundation; without it, the heights and radii below are numbers in a funhouse.
Heights: The Two Numbers That Govern Everything
A viewshed is a negotiation between two heights, and the plugin exposes both:
- Observer height: how far above the ground the eye or the instrument sits. A standing person, a lookout tower, a turbine hub, a camera on a pole: each is a different analysis wearing the same point. The observer points tool records it per point, defaulting to a human-scale value you should change on purpose rather than inherit by accident.
- Target height: how far above the ground the thing being seen rises. Zero asks "can I see the ground itself," the walker's and archaeologist's question. A target height of a building's or a turbine's stature asks the planner's question: "from where is the structure visible," which is the same computation run for a different master.
The radius matters too: sight lines end somewhere, and an analysis radius matched to the real question (the horizon from this height, the study area's edge) keeps the computation honest and finite. Earth curvature and refraction enter at distance: the plugin offers correction for both, because over kilometers the planet's curve drops the far ground and the atmosphere bends light slightly back, and a viewshed that ignores them overstates visibility at range. For a valley-scale analysis the corrections are small; for a coastal lighthouse question they are the analysis.

Binary and Cumulative: The Two Products
The plugin produces two kinds of answer. A binary viewshed, from one observer, marks each cell visible or not: the classic map, one viewpoint's world. A cumulative viewshed, from many observers, counts: each cell carries the number of observers that can see it. Cumulative is the planner's instrument, run from every proposed turbine, every lookout, every camera, to find the ground that is watched by all, by some, by none, and it powers the plugin's intervisibility thinking as well: which observers can see each other, the network question a chain of fire towers or relay masts asks. Choosing between them is choosing the question: "what does the visitor see from the summit" is binary; "where in this valley is truly unobserved" is cumulative, and the second question cannot be answered by stacking binary maps in your head.
Reading the Result Without Lying With It
A viewshed is a model with stated assumptions, and its map looks more certain than it is. The disciplines of honest reading:
- The DEM is bare earth or it is not. A terrain model without buildings and forest sees through both. If your DEM is a surface model, say so; if it is bare earth, the viewshed is a best case, and the woodland on the ridge is a co-author the map does not credit.
- Cell size is a claim. A 30 meter DEM cannot resolve the hedge, the wall, the single tree that decides a real sight line at close range. State the resolution beside the result, always.
- A viewshed is not a photograph. It computes geometric visibility, not legibility: haze, light, contrast, and the human eye all vote in reality and abstain in the model. The map says the ground is visible; whether the structure is noticeable is a further question, and conflating them is how viewsheds get misused in planning fights.
Distinguish the product from its neighbor while you are here: our hillshade guide makes a picture of terrain, light raking across slopes for the eye. A viewshed is not a picture; it is a computation about one point's sight. The two are confused because both start from a DEM and end in a raster, and the confusion ends careers of otherwise good analyses: shade is appearance, viewshed is evidence.
Intervisibility: When Observers Look at Each Other
The plugin's family includes a question the single viewshed cannot phrase: can the observers see each other? Intervisibility analysis takes the observer set and tests the sight lines between them, producing the network of who sees whom. It is the design tool for every chain of watching things humans build: fire lookout towers spaced so each stands in another's view, radio and microwave relays whose links are pure line of sight, camera networks with overlapping witness, signal mirrors in the age before all of these. The design logic inverts the viewshed habit: instead of asking what one point commands, you place points until the network closes, each new tower justified by the gaps in the cumulative map and the links it completes. Run it after the cumulative viewshed, not before: the cumulative map shows the unwatched ground, the intervisibility graph shows whether the watchers form a system or a coincidence of hills. Historical fire tower networks, built by men with plane tables and stubbornness, pass this test eerily well when modeled, which is the analysis paying its respects to the pre-digital craft.
Viewsheds for the Living World: Habitat and Heritage
Two application families deserve naming because they discipline the parameters differently. Heritage and landscape archaeology run viewsheds from barrows, hillforts, and stone circles to test whether monuments were sited to see and be seen, intervisibility among sites being a claim about prehistoric intention that the computation can support or embarrass. Their parameter honesty is exemplary: observer height at a standing person's eye, target at the monument's surviving height, and the bare-earth caveat printed in every paper, because the Neolithic tree cover is the one dataset nobody has. Ecology runs the computation in reverse, from a deer's or a raptor's world: visibility as exposure, the ground a prey animal can be seen on being the ground it must cross at cost. The viewshed from a nest site, a den, a road crossing, becomes a map of risk. Both families teach the same lesson back to the planners: the parameters are the argument. A viewshed whose heights and radius are not stated is a picture; stated, they are evidence that can be argued with, which is all any analysis should aspire to be.
A Worked Sketch: The Lookout Question
A land trust asks where a proposed viewing platform should stand to overlook a restored wetland. Observers: three candidate points, built with the observer tool at platform eye height. DEM: projected, 10 meter, bare earth, and the report says so. Run binary viewsheds for each candidate and a cumulative for the set. The binary maps answer the trust's real question comparatively (which platform sees the heronry, which is blind behind the reedbed rise), and the cumulative shows the wetland's unseen corner, which turns out to be the argument for the boardwalk extension nobody had budgeted. Total software cost: zero. Total honesty requirements: the assumptions paragraph, printed next to every map the analysis produced.
Related Guides
If this page answered part of the question, these GIS and open data guides cover the rest of the same ground:
- Watershed Delineation in QGIS: From a DEM to a Basin Boundary: The other great DEM pipeline: where the water goes, instead of where the eye goes.
- Network Analysis in QGIS: Shortest Paths and Service Areas on Your Own Streets: Reachability from a point, the viewshed's conceptual sibling on the road network.
- QGIS Hillshade: Turn a DEM Into Readable Terrain, and Fix the Z-Factor Trap: The picture of terrain, for contrast: appearance, not line of sight.
- QGIS Elevation Profile: Read the Terrain Along Any Line You Draw: The one-dimensional version of the same curiosity: what the ground does along a line.
Frequently Asked Questions
How do I run a viewshed in QGIS?
Install the Visibility Analysis plugin, reproject your DEM to a projected CRS, build an observer layer with the plugin's Create observer points tool (setting observer height and radius), then run the Viewshed analysis on the DEM and the observer layer. The output is a raster marking visible ground.
Why must the DEM be in a projected CRS?
Because viewshed geometry is distance geometry: radii, cell sizes, and sight lines assume square, meter-measured cells. A DEM in latitude and longitude degrees has cells that are not square and shrink with latitude, so results bend and radii lie. Reprojecting first is the standing rule.
What is the difference between binary and cumulative viewsheds?
A binary viewshed, from one observer, marks each cell visible or hidden. A cumulative viewshed, from many observers, counts how many observers can see each cell. Binary answers "what can I see from here"; cumulative answers "how watched is this ground."
What do observer height and target height change?
Everything. Observer height is how high the eye sits above the ground; target height is how high the thing being seen rises. A ground-level target answers whether terrain itself is visible; a tall target answers whether a structure would be visible, a different map from the same point.
Does a viewshed account for trees and buildings?
Only if your elevation model includes them. A bare-earth DEM sees through forest and buildings, producing a best-case viewshed. A surface model that includes canopy and structures gives the obstructed truth. State which model you used beside every result.
Photo credits: John Webb (Pexels); Mauricio Artieda (Pexels). Photos are served from this site; follow the credit to the library page for the original.