QGIS and OpenStreetMap are the two pillars of free mapping, and they connect in three distinct ways that serve three distinct jobs. Most beginner confusion comes from wanting one and doing another: trying to edit a basemap that is only a picture, or downloading a whole country's data to use as a backdrop. This guide separates the three routes cleanly: the built in basemap for context, the QuickOSM plugin for live vector data about the area on your screen, and extract files for serious offline or regional work. By the end you will know which door to use, and the rules that apply behind each one.
Home / GIS and Open Map Data for Beginners
How to Use OpenStreetMap in QGIS: Basemap, Vector Downloads, and Full Extracts
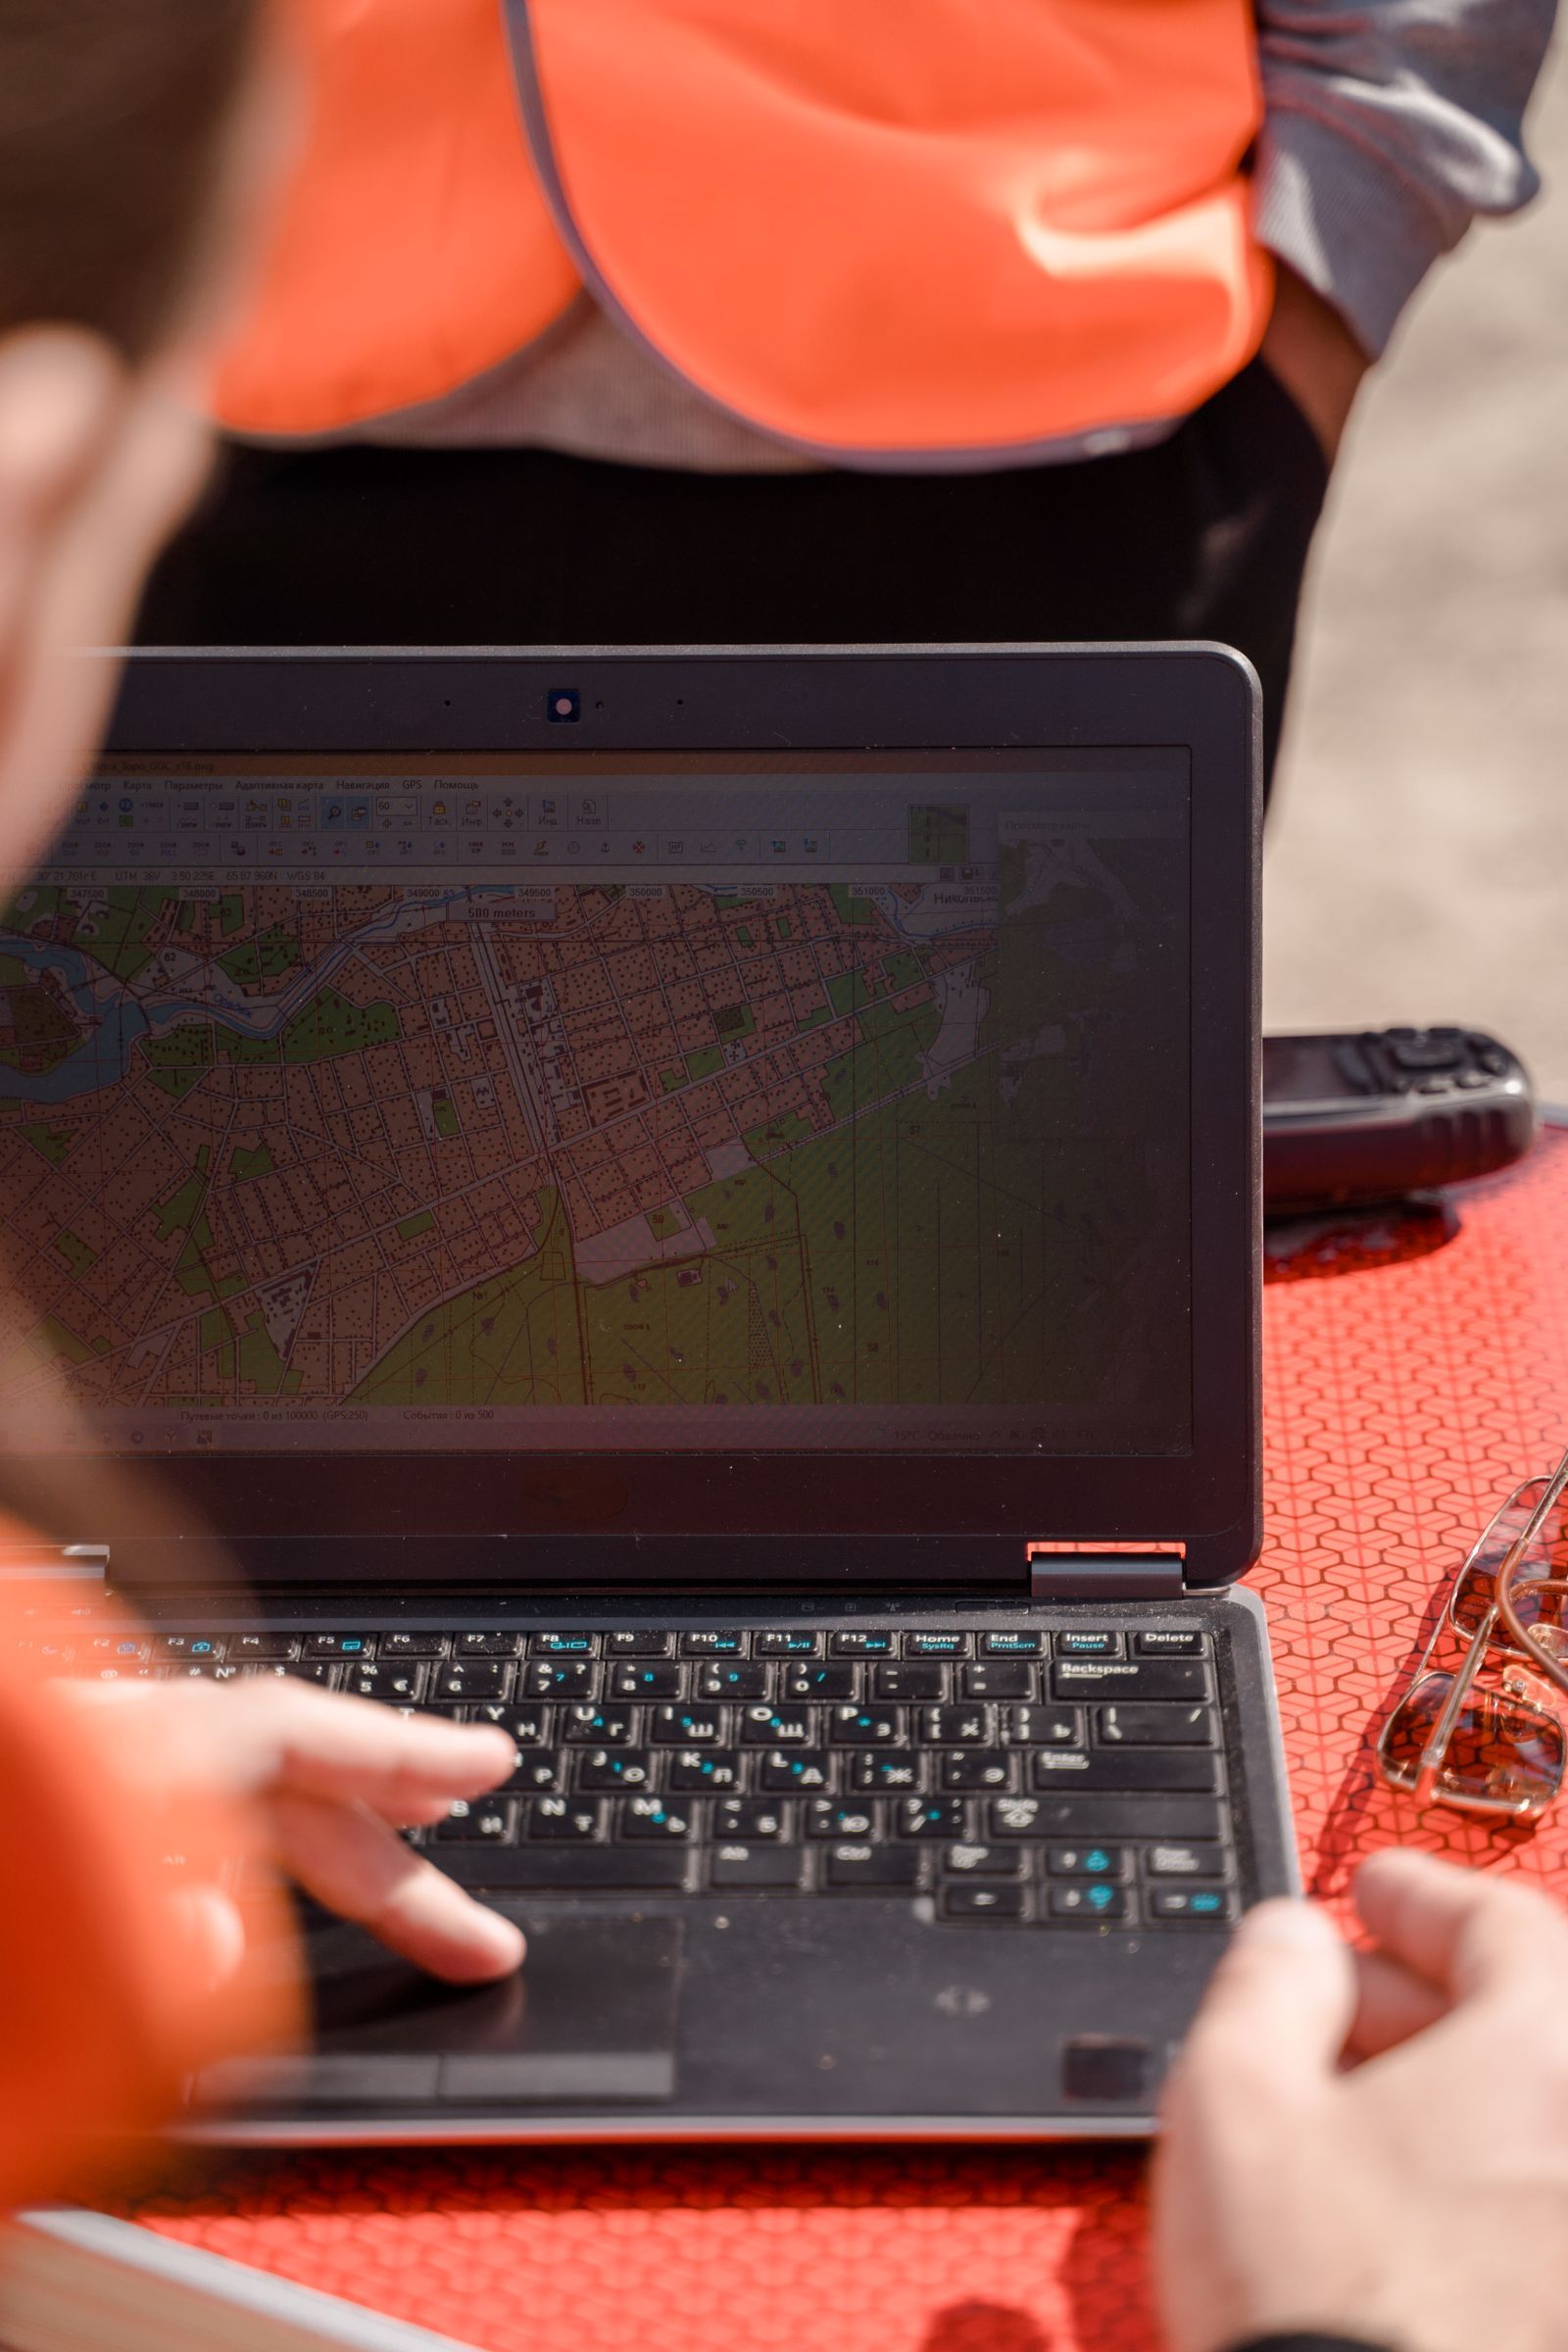
Photo: Ron Lach / Pexels
Interactive map
Coordinate Explorer: Read Off the Corners of Your Area
Before you frame a QuickOSM query or choose an extract, click the corners of your study area here and note the exact coordinates. Knowing your extent in numbers is what keeps queries fast and downloads the right size.
Decimal degrees40.689167, -74.044444
Latitude40.689167° N
Longitude74.044444° W
Degrees minutes seconds40° 41' 21.00" N, 74° 02' 40.00" W
Degrees decimal minutes40° 41.350' N, 74° 02.667' W
Plus code87G7MXQ4+M67
Map data © OpenStreetMap contributors. Coordinates are read from the map itself, in the WGS 84 system your phone uses.
Route One: The Basemap, Already Built In
QGIS ships with an OpenStreetMap basemap connection installed. In the Browser panel, find XYZ Tiles, expand it, and double click OpenStreetMap. A rendered map of the world appears as a layer, and you can zoom to your area of interest. No plugin, no download, no configuration: the connection is preconfigured with the standard tile address, https://tile.openstreetmap.org/{z}/{x}/{y}.png, serving tiles up to zoom level 19. If the connection is ever missing, recreate it from the XYZ Tiles right click menu with that URL and the name OpenStreetMap.
Understand what this layer is: a stream of pre rendered images, tiles, fetched as you pan. It is a backdrop and a reference, nothing more. You cannot select its roads, query its buildings, or restyle its colors, because there is no data behind the picture in your project. Two rules ride along. The layer carries the attribution © OpenStreetMap contributors, which must remain visible on any map you publish from it. And the tile service runs on donated infrastructure under a usage policy that forbids bulk downloading tiles for offline use or scraping whole regions; for those jobs, the policy itself points you to extracts, Route Three below. For a quick backdrop under your own data, though, nothing beats two clicks. Our QGIS tutorial for beginners gets you to the project this basemap belongs in, and how to use OpenStreetMap covers the map itself as a reader.
Route Two: Real Vector Data With QuickOSM
When you need the actual features, roads you can select, buildings you can count, rivers you can style, install the QuickOSM plugin, the standard bridge to the live OpenStreetMap database. Our QGIS plugins guide covers plugin installation generally; QuickOSM is the one to install first.
- Open QuickOSM from the Vector menu after installing it.
- In the quick query, choose a key and value: for example key highway with no value for all roads, or key amenity with value school for schools.
- Set the extent to Canvas extent, so the query covers the area on your screen, which you should have framed using the basemap from Route One.
- Run the query. QuickOSM asks the Overpass API, OpenStreetMap's read only query service, and returns real vector layers, points, lines, and polygons, styled and ready to analyze.
Two disciplines make this route behave. Keep extents modest: a city district returns in seconds, a whole country through Overpass will time out and is extract work, not query work. And respect the data you receive: it is the live community database described in our OpenStreetMap download guide, licensed for use with attribution, and as current as the last volunteer's edit, which for active areas means very current indeed.

Route Three: Extracts for Regions and Offline Work
For a whole city, region, or country, or for any offline project, download an extract once and load the file. Services such as Geofabrik publish free, regularly updated extracts in .osm.pbf format, the compact binary form of OpenStreetMap data. In QGIS, drag the .osm.pbf file into the project, or open it through the data source manager, and QGIS asks which sublayers you want: points, lines, multilinestrings, and multipolygons, each carrying the tags as attributes. Style them, filter them, analyze them, all offline, all yours. This is the route the tile policy and the Overpass limits both point toward, and it is how professionals actually work with OpenStreetMap at scale. The coordinates explorer above is handy here for reading off the corner coordinates of an area before you choose an extract or frame a query, the same trick our OpenStreetMap API guide uses for bounding boxes.
Choosing the Route, and the Rules That Travel With All Three
| Your job | Route | Why |
|---|---|---|
| Backdrop under your own data | Basemap XYZ layer | Two clicks, always current, nothing to store |
| Analyze features in a neighborhood | QuickOSM query | Real vectors, live data, screen sized extent |
| Work on a region, or offline | .osm.pbf extract | Complete data, no server limits, portable |
Attribution travels with every route: maps and products built on OpenStreetMap data credit © OpenStreetMap contributors, and the data is available under the Open Database License, which also asks that improvements to the database itself be shared back when distributed. The tile usage policy binds Route One only, but its spirit, do not hammer donated servers, applies to Overpass too: cache your query results in the project rather than re running them idly. Treat the commons gently and it stays fast for everyone, including you.
Three doors, three jobs: pictures for context, queries for neighborhoods, extracts for regions. Pick by the job, credit the contributors, and QGIS plus OpenStreetMap becomes the free GIS stack that needs nothing else to start real work.
Making the Downloaded Data Yours: Styling and Filtering
Raw OpenStreetMap vectors arrive wearing every tag the community gave them, and the beginner's next skills turn that abundance into a map. Filter by attribute. Open a QuickOSM layer's attribute table and the tags sit in columns; a filter expression such as keeping only features whose highway tag marks them as paths, or only buildings of a chosen type, thins a citywide download to your subject in seconds. Style by category. In the layer's symbology, switch from single symbol to categorized on a meaningful field, road class for lines, amenity type for points, and the map starts explaining itself in color. Save the result properly. Export your styled, filtered layers to GeoPackage, the working format our GeoJSON vs shapefile comparison recommends, so the project no longer depends on re running queries. Refresh deliberately. OpenStreetMap improves daily; a project that lives for months should re pull its area before publication rather than assume, and note the pull date in the project's records, because "the map as of March" is a claim a reader can check. These four habits, filter, style, save, refresh, are the difference between downloading data and working with it, and they are the same habits whether the source was a query, an extract, or your own survey.
A First Project That Uses All Three Routes
Theory settles better with a project, so here is one that takes an afternoon and teaches every route in this guide. Map the schools of your town. Start with Route One: add the OpenStreetMap basemap and frame your town, learning the canvas and the layer panel as you go. Move to Route Two: run QuickOSM with key amenity and value school over the canvas extent, and receive real point and polygon layers for every school the community has mapped. Count them in the attribute table, style them with a distinct symbol, and filter out any that fall outside your town's boundary if you have one. Then Route Three: download your region's .osm.pbf extract, load the points and multipolygons, and repeat the school selection by filtering tags, comparing the result with the live query; differences between them are the edits made since the extract was cut, a small lesson in data currency you will never forget. Finish by saving the school layers to GeoPackage with the basemap credited, and export a simple map image. You will have used pictures, live queries, and bulk data for exactly the jobs each is for, which is the whole content of this guide, performed once by your own hands.
Attribution in Practice: What to Put on Your Map
Since every route in this guide ends in an obligation, here is the concrete form it takes. On a printed or exported map, place the credit where map credits live, along the lower edge: "© OpenStreetMap contributors" suffices for the basemap and for data layers drawn from queries or extracts. On a web map, the credit belongs in the corner attribution control, which QGIS exports and web libraries provide by default, and it should link to openstreetmap.org when the medium allows. If your map also transforms the data substantially, a line in the accompanying notes naming the source and the date of the pull is both good practice and good scholarship: data with a date can be argued with, corrected, and updated, while data from nowhere and nowhen can only be believed. The contributors who mapped your town asked for exactly this and nothing more, which makes it the easiest professional obligation in all of GIS to honor completely.
Related Guides
Readers working through this topic usually need its closest companions too. These GIS and open map data guides cover the neighboring ground:
- How to Use qgis2threejs: Turn a QGIS Project Into a 3D Web View: qgis2threejs is the QGIS plugin that turns a desktop project into a 3D view anyone can open in a browser.
- QGIS Calculate Area of a Polygon: $area, area($geometry), and the Degrees Trap: QGIS offers two area functions that answer different questions: $area respects your project's ellipsoid and measurement settings and returns real...
- QGIS Heatmap: The Renderer for a Picture, the KDE Algorithm for a Raster: QGIS offers two different things called heatmap, and choosing between them is the first skill: the heatmap symbology renderer draws a live density...
Frequently Asked Questions
How do I add OpenStreetMap as a basemap in QGIS?
It is already installed. In the Browser panel, expand XYZ Tiles and double click OpenStreetMap. The connection uses the tile address https://tile.openstreetmap.org/{z}/{x}/{y}.png and serves tiles to zoom level 19. If the entry is missing, recreate it from the XYZ Tiles context menu with that URL.
Why can I not select or edit features on the OpenStreetMap basemap?
Because the basemap is a stream of rendered image tiles, not vector data. It is a picture of the map, fetched as you pan. To select, style, or analyze real features, use the QuickOSM plugin to query live vector data for your area, or load a downloaded .osm.pbf extract.
What is QuickOSM and what does it query?
QuickOSM is a free QGIS plugin that queries OpenStreetMap's Overpass API by key and value, such as all highways or all schools, within an extent you choose, usually the canvas. It returns genuine vector layers you can style and analyze. Keep extents modest, around a town or city district, since very large queries time out.
What is an .osm.pbf file and where do I get one?
It is the compact binary format for OpenStreetMap data extracts: complete map data for a region in one file. Free providers such as Geofabrik publish country and regional extracts, updated regularly. Download the region you need, drag the file into QGIS, and choose the sublayers, points, lines, and polygons, to load.
Can I download OpenStreetMap tiles for offline use?
Bulk tile downloading is against the OpenStreetMap tile usage policy, because the tile servers are donated infrastructure meant for live browsing. The sanctioned offline route is data, not pictures: download an .osm.pbf extract and render or use the vectors locally in QGIS as long as you like.
Do I need to credit OpenStreetMap in maps I make?
Yes. Any map or product using OpenStreetMap data must carry the attribution "© OpenStreetMap contributors." The data is licensed under the Open Database License, which also has share alike terms for distributed databases derived from it. Attribution is required on basemap based maps too, where QGIS shows it automatically in the layer.
Photo credits: Ron Lach (Pexels); Polina Zimmerman (Pexels). Photos are served from this site; follow the credit to the library page for the original.