Of everything OpenStreetMap contains, building footprints are what the world most often comes for: the outlines of every structure in a place, for flood models, solar potential studies, population estimates, 3D cities, and a hundred other jobs that begin with "first, get every building." The data is there, traced by volunteers from imagery over two decades. Getting it out, cleanly, at the scale you need, is a routing problem with three good answers and one bad habit, downloading a planet-sized file to keep a neighborhood. This guide gives you the routes in ascending order of area, the query pattern that powers the flexible one, the data realities nobody warns you about, courtyards that arrive as relations and heights that mostly do not arrive at all, and the license terms that travel with the footprints wherever they go. For the general download landscape this feature lives in, our OpenStreetMap download guide covers the three routes by area size for all data; here we go deep on the one feature.
Home / GIS and Open Map Data for Beginners
OpenStreetMap Building Footprints: Extract Them by the Route That Fits Your Area

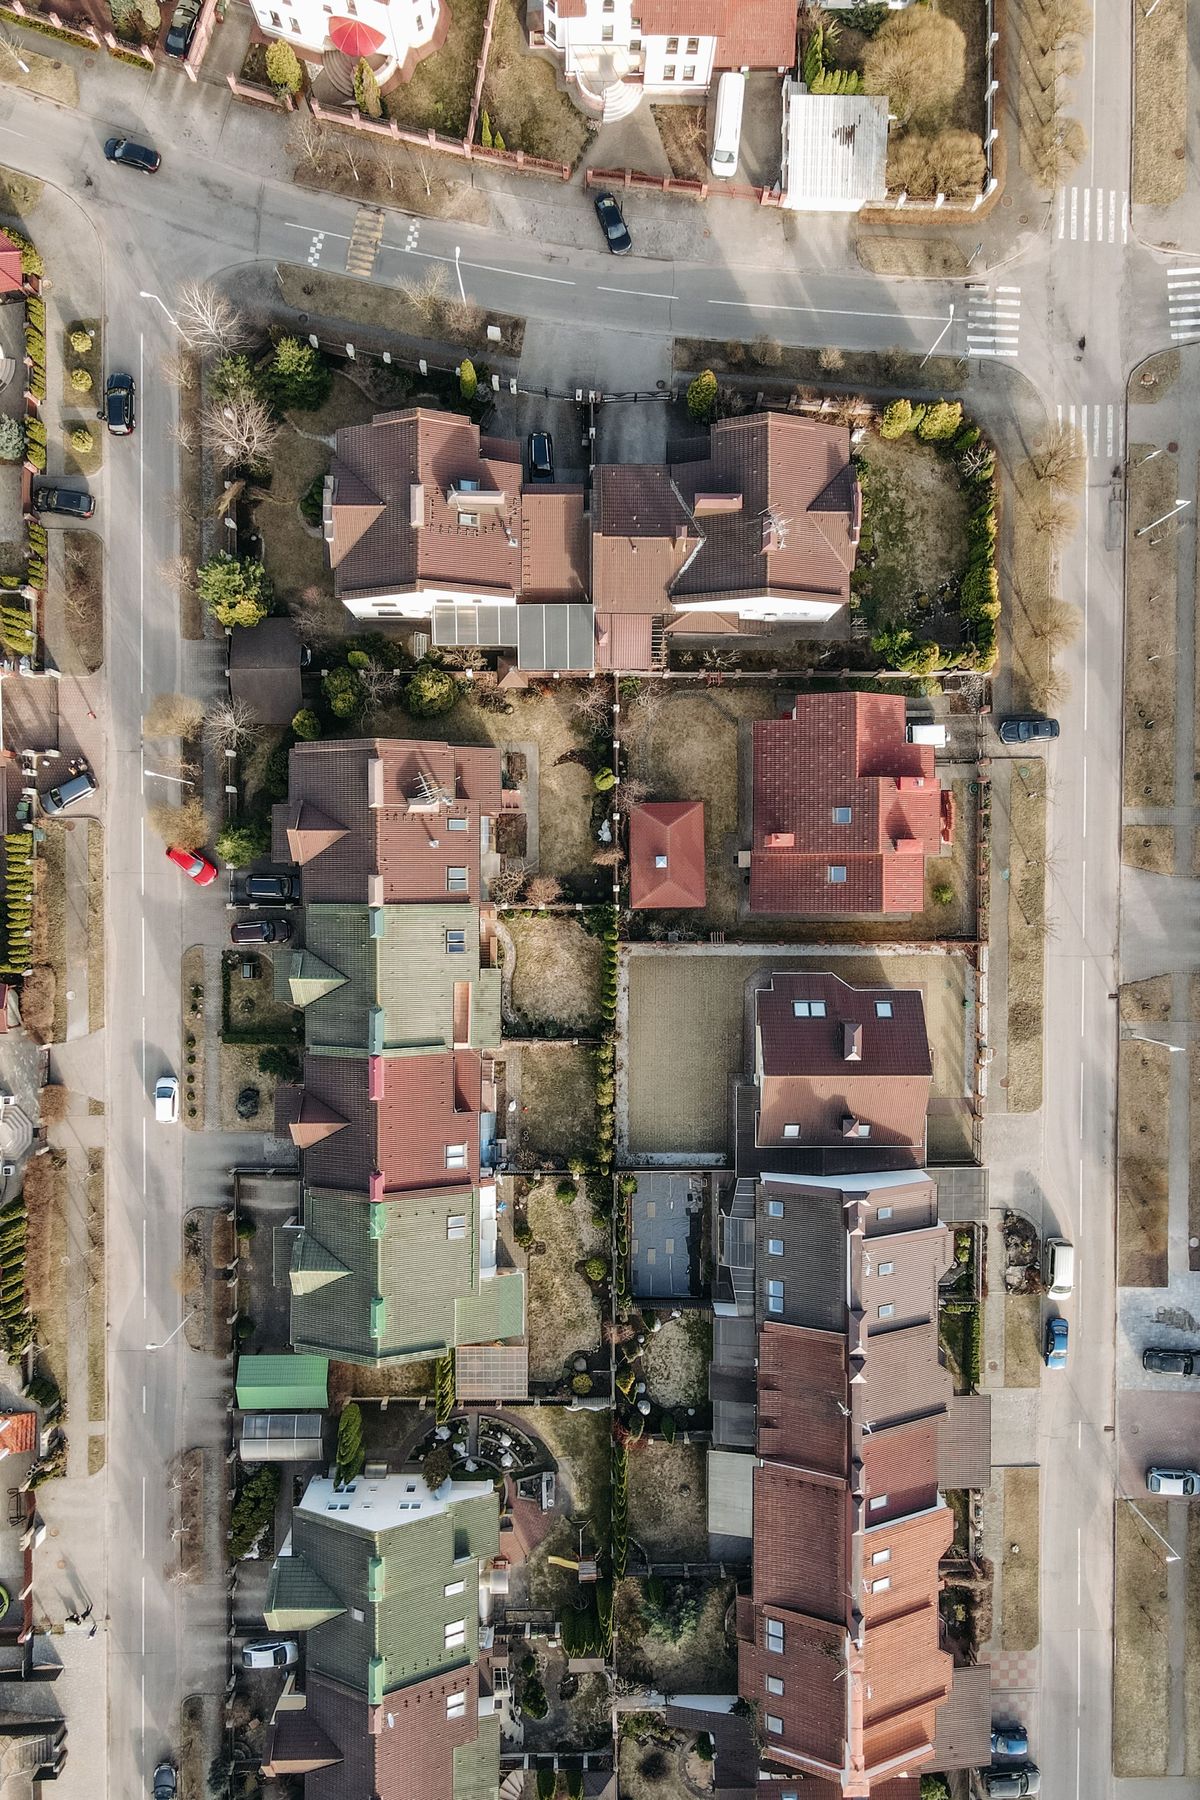
Photo: Umer Nazir / Pexels
Extract the Footprints: The Checklist
Check off each step as you finish it. Your progress stays on this page.
0 of 8 complete
0% done
Route One: The Export Tab, for a Neighborhood
For a few streets or a campus, the simplest extraction needs no query language at all. On openstreetmap.org, zoom to your area, open the Export tab, confirm the bounding box covers your ground, and export. You receive the area's OpenStreetMap data, buildings included, as one file, which you then open in QGIS or another tool and filter to the building features. The Export route has an honest size ceiling: it serves small areas, and it will refuse or fail on a whole city, which is not a limitation to fight but a signpost to the next route. Its virtue is immediacy: two minutes from reading this sentence to holding footprints for a study area, with nothing installed and nothing queried.
Route Two: Overpass, for a Town or a Theme
When the area grows, or the request sharpens, "all buildings in this town," "only schools in this county," the tool is Overpass, the OpenStreetMap query API, usually through the Overpass Turbo web interface. The pattern at the heart of every building query is the tag itself: buildings in OpenStreetMap are features tagged building=, the asterisk meaning any value, since the tag's value describes the building's use, building=house, building=commercial, building=school, while the footprint is the geometry they all share. A minimal query asks the area you name or the box you draw for every way and relation carrying that tag, and outputs their geometry. From that skeleton, the refinements are all one-line changes: restrict the value to one use, add a second tag condition, or ask for a different feature alongside. Overpass rewards this incremental style: start with building= over a small area, look at what arrives, and tighten the query against real data rather than imagining the perfect query in advance.
Respect the service while you use it. Overpass is a shared community resource with fair-use limits, on the order of ten thousand queries and about a gigabyte of downloads per day for a user, and when it is overloaded it answers with HTTP 429, the too-many-requests signal, which is an instruction to slow down and shrink the query, not to retry in a loop. A building query over a metropolis is the classic way to meet that signal; the cure is route three.
Route Three: Extracts, for a Region
For a state, a country, or anything you will query repeatedly, download once and filter locally. Geofabrik publishes OpenStreetMap extracts by region, updated regularly, in files that open in QGIS or process with command-line tools. Download your region, then filter to buildings with your tool of choice: a QGIS filter on the building field, the QuickOSM plugin running your Overpass-style request against the local file, or a command-line filter that keeps only building features and writes a small, fast layer from a large, slow one. The pattern generalizes beyond buildings, which is why it is the professional default: the extract is a local mirror of everything, and every feature extraction after the first is free, instant, and nobody's server load but yours.
A Minimal Overpass Query, Read Line by Line
Queries look forbidding and are mostly punctuation around one idea. Here is the working skeleton for all buildings in a named place, small enough to take apart:
```
[out:json][timeout:60];
area["name"="Springfield"]->.searchArea;
(
way"building";
relation"building";
);
out geom;
```
The first line sets the output format and gives the server a time budget, a courtesy that also protects your query from running unbounded. The second line finds the named place and stores it as the search area; substitute your own town, county, or city, and if the name is ambiguous, the interface's map-bounded variant of the same pattern avoids the wrong Springfield problem. The middle block is the request itself, and it asks for two kinds of feature: ways tagged building, which are the ordinary polygon footprints, and relations tagged building, which are the courtyard buildings from the next section, and skipping the relation line is how pipelines silently lose exactly the most complex structures in town. The final line, out geom, is the one beginners forget and regret: without it, ways arrive as references to nodes rather than as drawn geometry, and your footprints open as nothing. Run this over a small place first. Overpass Turbo shows the result on the map immediately, and watching your query draw real rooftops is the fastest teacher the API offers: tighten the tag, widen the area, and re-run, and within ten minutes the syntax stops being syntax and becomes a tool you think with.
What Arrives: Polygons, Relations, and Courtyards
Most buildings arrive as simple polygons, one closed outline each. The exception teaches you something about the data model: a building with a courtyard, a ring-shaped school, a hospital around a garden, cannot be one simple polygon, because its outline has a hole. OpenStreetMap represents these as multipolygon relations: an outer ring and one or more inner rings bound together by a relation that says "one building, with holes." Tools that flatten relations carelessly produce filled courtyards and wrong areas; tools that respect them reproduce the building faithfully. When your footprint layer feeds area calculations, flood exposure, or 3D extrusion, spend one minute checking a courtyard building in your area against the imagery. That single check tells you whether your pipeline handles relations, and it is far cheaper than discovering the answer from a client's question.
Heights: The Honest Section
Footprints are two-dimensional, and the third dimension in OpenStreetMap is sparse. Some buildings carry a height tag with a measured value; more carry building:levels, a count of floors; most, in most places, carry neither. Plan around that honestly. Where levels exist, the working estimate is levels times about three meters per floor, and it is an estimate, useful for a skyline's impression and a shadow study's first pass, and it must be labeled as an estimate wherever it is used, because a floor is not a unit of measure and a warehouse level is not a cottage level. Where neither tag exists, the footprint has no height story to tell, and the professional move is to say so in your metadata rather than invent a default and let it leak into conclusions. For many jobs, exposure, area, density, the footprint alone is the whole requirement, and the honest absence of height costs nothing. Our guide to OpenStreetMap attribution covers the credit line this data requires; the next section covers the rest of the license.
Completeness Is a Place, Not a Property of the Data
One expectation to set before your first extraction: OpenStreetMap building coverage is superb in some places and thin in others, because it was traced by volunteers and by organized imports that reached different regions at different times. A European city center may have every garden shed; a rural county may have the town centers and little else. This is not a flaw to complain about but a fact to measure, and the measurement is cheap: extract your area, overlay the footprints on current imagery, and look at three sample blocks, dense, middling, and sparse. If the sheds are there, trust the layer broadly. If whole streets are missing, your project has a data problem that no query refinement can fix, and the conflated alternatives mentioned in the license section, or a local government parcel layer where one exists, become the honest sources. Report coverage the way you found it in anything you publish from the footprints. A density map with a silent hole in it is worse than no map, and the hole is only silent if you knew and said nothing.
The License in Practice
OpenStreetMap data is published under the Open Database License, the ODbL, and two duties matter for building footprints. Attribution: wherever the footprints are shown or used, credit OpenStreetMap and its contributors; the credit is not a courtesy but a license condition. Share-alike for derived databases: if you build a database from OpenStreetMap data and distribute that database, the derived database must be offered under the same license. Producing a map or an analysis from the data is a different act from distributing a derived database, and the license treats them differently, but the safe working rule for a footprints project is simple: credit always, and if you publish a dataset built from the footprints, publish it under the ODbL with the credit attached. And one alternative deserves an honest mention for teams who need footprints at continental scale with heights and identifiers already conflated: datasets such as Overture Maps and the Microsoft building footprints combine OpenStreetMap with other sources into ready-made footprint layers. They trade the freshness and tag richness of raw OpenStreetMap for convenience, and for some projects that trade is right. Know that it exists; choose with your eyes open.
Related Guides
This guide does not stand alone. The GIS and open map data guides below take up the questions it leads into:
- OpenStreetMap vs Leaflet: Data vs Library, the Distinction That Ends the Confusion: OpenStreetMap and Leaflet are not competitors, and comparing them directly is a category error that confuses every beginner who meets them in the...
- OpenStreetMap Routing: OSRM, Valhalla, GraphHopper, and Which One to Call: OpenStreetMap itself does not route you anywhere; the routes come from a family of engines that read its data, each with a different design.
- OpenStreetMap vs Overture Maps: The Living Database vs the Production Snapshot Built on Top of It: Overture Maps is not a rival to OpenStreetMap; it is built on it.
Frequently Asked Questions
How do I download just the buildings from OpenStreetMap?
Pick the route by area size. For a neighborhood, use the Export tab on openstreetmap.org and filter the result to buildings. For a town or a themed request, run an Overpass query for building=* over your area. For a region, download a Geofabrik extract and filter it locally in QGIS or with a command-line tool.
What does building=* mean in an Overpass query?
It is the tag pattern for buildings. OpenStreetMap features are tagged with key=value pairs, and buildings carry the key building with a value describing their use: building=house, building=commercial, and so on. The asterisk matches any value, so building=* selects every feature tagged as a building, whatever its use.
Why do some buildings download as relations instead of polygons?
A building with a courtyard or hole cannot be drawn as one simple polygon. OpenStreetMap stores it as a multipolygon relation, an outer ring plus inner rings bound into one feature. Good tools reconstruct the building, hole included; careless ones fill the courtyard in. Check one courtyard building against imagery to learn which kind of tool you have.
Can I get building heights from OpenStreetMap?
Sometimes. A minority of buildings carry a height tag or a building:levels count. Levels times roughly three meters per floor is the standard estimate, and it must be labeled an estimate. Most buildings in most places carry neither tag, and for those the data honestly has no height; do not invent one in your outputs.
What are the rules for using OpenStreetMap building footprints?
Two license duties under the ODbL: credit OpenStreetMap and its contributors wherever the data is used, and if you distribute a database derived from the data, share it under the same license. Also respect the services: Overpass enforces fair-use limits, roughly ten thousand queries and a gigabyte a day, and answers overload with HTTP 429.
Photo credits: Umer Nazir (Pexels); Pavel Danilyuk (Pexels). Photos are served from this site; follow the credit to the library page for the original.