Somewhere in OpenStreetMap's database, largely unnoticed by the people who use the map to find coffee, sits a model of the world's electricity transmission grid: the high lines marching across farmland, the substations behind their fences, the cables under the streets. It is there because the power key family gives mappers a complete vocabulary for it, and because a dedicated community of grid mappers has spent years tracing pylons from aerial imagery. This guide teaches that vocabulary as a system: the line and cable distinction, the towers and substations that punctuate the network, and the attributes, voltage above all, that turn geometry into an engineering dataset. It then surveys what the world has built on the data, the grid maps and the energy-system models, with their figures attributed to the projects that report them. And it closes with the caveat this data's honest consumers all print: the grid in OpenStreetMap is community-mapped, magnificent in places, absent in others, and an empty area proves nothing except that nobody has mapped it yet.
Home / GIS and Open Map Data for Beginners
OpenStreetMap Power Lines: The power Key Family and the Grid It Draws
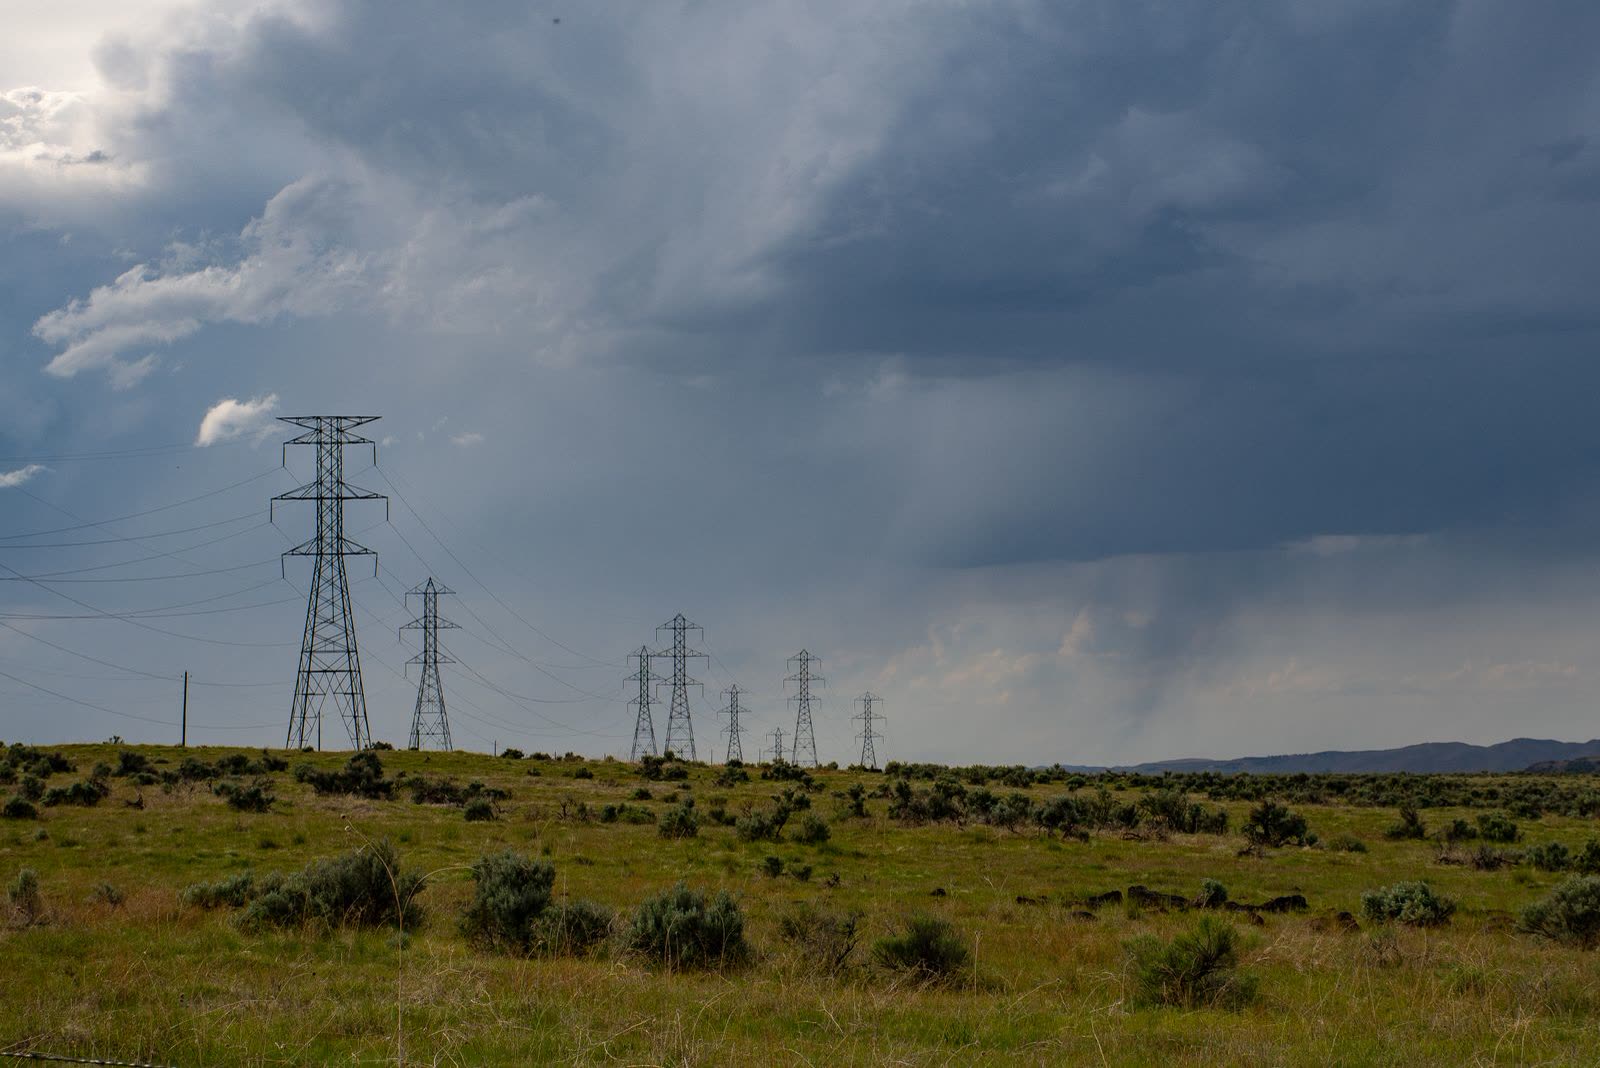
Photo: Brett Sayles / Pexels
Draw the Grid Accurately: The Power Checklist
Check off each step as you finish it. Your progress stays on this page.
0 of 7 complete
0% done
The Conductors: power=line and power=cable
The network's edges come in two kinds. power=line is the overhead line, the conductor on towers or poles that the landscape shows you. power=cable is the buried or submarine conductor, invisible at the surface and mapped from records, plans, and the infrastructure that betrays it. The distinction is not pedantry: the two have different failure modes, different planning implications, and different visibility to the mapper, and consumers from renderers to researchers rely on the split. Around the two majors orbit the distribution-level values, such as power=minor_line for the smaller overhead lines on poles that serve streets and farms, which keeps the transmission giants and the local feeders from being confused in the same class. A line in this system is a way like any other in OpenStreetMap, nodes and geometry, but its meaning comes from the attributes hung on it, and the next section's voltage tag is the one that turns a drawn line into a ranked artery of a national grid.
The Furniture: Towers, Poles, Substations
A grid is nodes as well as edges, and the family tags the furniture with the same care. power=tower marks the transmission pylon, the lattice giant; power=pole its smaller wooden and concrete kin at distribution level. power=substation marks the fenced yards where voltage is transformed and circuits are switched, the network's joints, with refinements for the transformers and switchgear within and around them. Mapping the furniture is what elevates the dataset from lines on a map to a topology: a line that ends at a substation connects two parts of a system, and a tower's position is a surveyed point in an asset register the utilities themselves sometimes consult the crowd to complete. The field discipline mirrors the waterways family's: tag what stands there, at the class it earns, and let the network emerge from accurate parts rather than drawing impressive lines through unsurveyed country.
The Attributes: Voltage, Circuits, Operator
Three attribute families do the engineering work. voltage records the line's operating voltage in volts, the single most analytically valuable tag in the family, because voltage is the grid's hierarchy: it separates the continental backbone from regional transmission and local distribution, and nearly every consumer filters or ranks by it. circuits counts the electrical circuits a line carries, which is not the same as its wire count and matters to capacity reasoning. operator names the company or authority that runs the asset, the key that lets a continental dataset be divided into the organizations responsible for its parts. Supporting tags refine towers, line attachments, and substation contents for the specialists. The pattern is the tag-family pattern this site teaches elsewhere: a geometry key that says what the thing is, and attribute keys that say how much, how many, and whose, recorded in the forms the wiki's power pages document, so that a line drawn in one country means the same to software as a line drawn in another.
What the World Builds on It
The consumers prove the data. Global Grid, a project mapping the world's power grid from OpenStreetMap, draws its map from power=line and power=cable ways at the high voltages, 220 kV and above in its presentation, publishing its own voltage tables and substation counts as the project's reported figures. National and regional viewers, such as the Map of Grid layering OpenStreetMap transmission for Canada and Mexico, serve planners and the curious the same data at home scale. Most consequentially, the energy-modeling community builds research datasets on it: PyPSA-Eur, the European energy system model published in Nature Scientific Data, constructs its transmission network from OpenStreetMap data extracted through Overpass, which means peer-reviewed energy research is running on the crowd's pylons. Each of these consumers attributes its statistics to itself, and this guide follows them: the figures belong to the projects that computed them. What belongs to the tag family is the enabling fact, that a shared vocabulary, consistently applied by volunteers, produced infrastructure data good enough to model a continent's energy future on.
The Completeness Caveat, Printed Plainly
Every honest consumer of this data prints the same warning, and this guide prints it in their spirit: OpenStreetMap's grid is community-mapped, and its completeness varies enormously. Some countries' transmission networks are mapped to a standard utilities envy; elsewhere, whole regions show nothing, not because the grid is absent but because the mappers have not arrived, or because aerial imagery, the grid mapper's main source, is poor, or because local practice restricts infrastructure mapping. Two reading rules follow. Presence is strong evidence; absence is weak. A line in the data, with voltage and operator, is a fact you can build on, subject to ordinary verification. An empty map is a statement about mapping, not about electricity, and any analysis that treats unmapped as unpowered will produce confident nonsense. Grid mappers add a third rule from their own ethics: map from imagery and public sources, and respect the local norms and laws around critical infrastructure, which vary and which the community's wiki pages discuss. The dataset's power, to borrow the word, comes precisely from being built openly under those rules.
How the Data Gets There: The Grid Mapper's Craft
Behind the tag family stands a mapping practice with its own techniques, worth understanding because it explains the data's texture. The primary instrument is aerial and satellite imagery: a transmission line is one of the most legible objects in an overhead photograph, a ruled line of towers across farmland, and grid mappers trace lines tower by tower, placing power=tower nodes at each pylon's photographed position and joining them with the line way, reading the tower's design for hints about voltage and circuits. Substations are traced as areas from their unmistakable fenced yards of gantries and transformer blocks, then attributed with operator and voltage from public records, utility maps, and regulatory publications where those exist. Ground survey contributes what imagery cannot: the plates and labels on towers and substation fences, photographed by mappers who treat a pylon's data plate the way building mappers treat an address. And in some countries, official open data has been imported under the community's import discipline, which is why completeness maps of this dataset look like patchworks of national policy as much as of mapper enthusiasm. The craft's ethic runs through all of it: public sources, imagery, and observation, never trespass, and a standing respect for the fact that the infrastructure is critical, which the community's documentation discusses in the open. The dataset is what that ethic, patiently applied, accumulates into.
Underground and Undersea: The Cable Half of the Story
The family's quieter half deserves a final look, because the grid's future is increasingly buried. power=cable ways carry the underground transmission of dense cities, where overhead lines cannot go, and the submarine interconnectors that stitch islands and countries into shared grids, some of the most strategically significant lines on earth, drawn as cables across the seabed in the same database that holds a village's minor line. Their mapping leans on records rather than imagery, since a buried cable photographs as a field, and their attribution leans on the published sources, utility announcements, regulatory filings, marine charts, that grid mappers cite. For consumers, the cables are a reminder that the visible grid is a fraction of the real one, and that the tag family's line-versus-cable split encodes an engineering truth, different assets, different risks, different maintenance, that a single undifferentiated power line class would have lost. The map's most important lines, increasingly, are the ones it cannot show you from an airplane.
Reading a Line in the Landscape
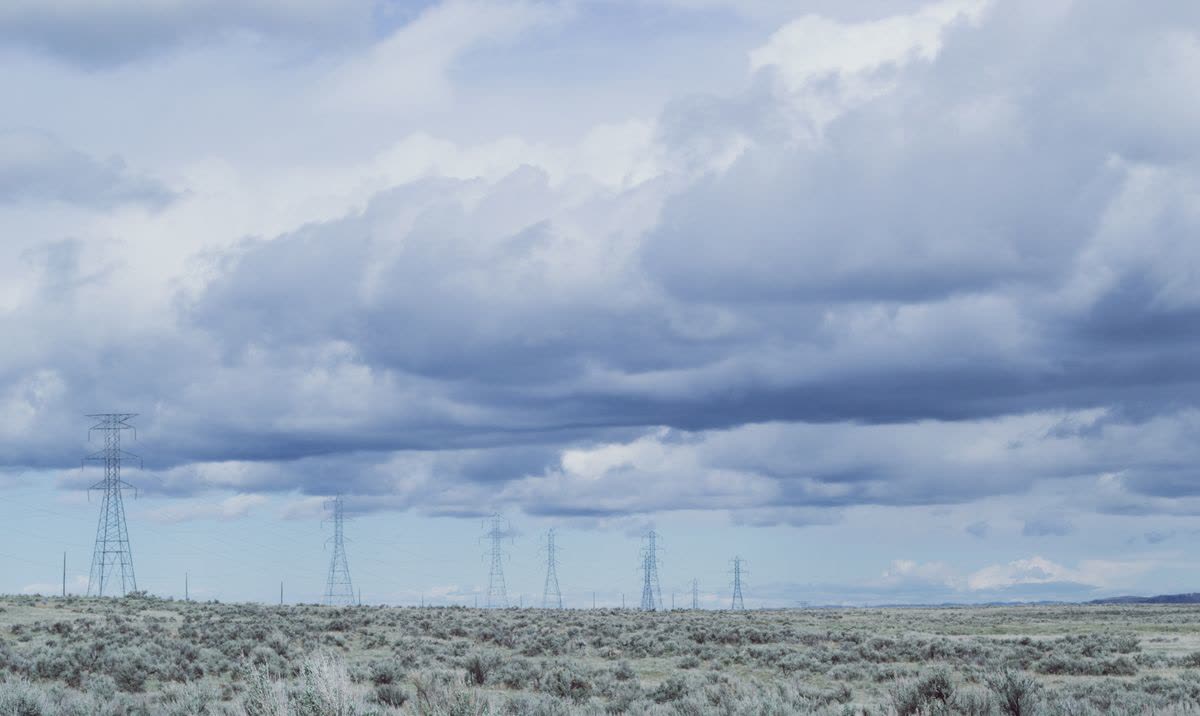
A short field coda, because this family rewards the eye as much as the database. A transmission line announces its rank before you read a single tag: the tower's height and arm span grow with voltage, the insulator strings lengthen, the conductor bundles multiply, and a mapper who has learned the silhouettes can estimate a line's class from a ridge away, then check the estimate against the data and find the dataset, as often as not, already knows. Substations read the same way at ground level, the fence, the gantry rows, the transformer hum behind the warning signs. None of this substitutes for the attributed record, but it closes the loop between the map and the territory in a way few datasets offer: this is infrastructure you can see, verify, and understand from a public road, and the power key family is simply the written form of that legibility.
For the general reader, the family's presence changes the map itself in one more way worth noticing: power infrastructure is among the features the standard style draws at wide zooms, so the lattice towers marching across a zoomed-out countryside are this dataset surfacing in everyone's cartography, a reminder that the map's familiar face is a hundred specialist datasets, each with its own community, showing through at once.
Related Guides
If this page answered part of the question, these GIS guides cover the rest of the same ground:
- OpenStreetMap Waterways: The waterway Key Family: The other great linear network, with the same tag-family logic.
- OpenStreetMap Tags: The Grammar of the Database: The grammar of keys and attributes this family speaks fluently.
- OpenStreetMap Neighborhood Boundaries: Relations and Nodes: Another place where the database's modeling choices decide what consumers can know.
- OpenStreetMap History: Reading the Biography of the Data: How to see who built a dataset and when, completeness questions included.
Frequently Asked Questions
What is the difference between power=line and power=cable?
Overhead versus buried. power=line is the conductor carried on towers or poles; power=cable is the underground or submarine conductor, mapped from records and surface evidence. Distribution-level overhead lines use power=minor_line.
Why does the voltage tag matter so much?
Voltage is the grid's hierarchy. It separates the high-voltage transmission backbone from regional and local distribution, and nearly every map and model built on this data filters or ranks lines by it. A line without voltage is geometry; with it, it is infrastructure.
What is mapped besides the lines themselves?
The furniture: power=tower for transmission pylons, power=pole for distribution poles, and power=substation for the yards where voltage is transformed, plus attributes such as circuits and operator that make the collection a network dataset.
Can I trust OpenStreetMap's grid for research?
Major projects do, including the PyPSA-Eur energy model published in Nature Scientific Data, built from OpenStreetMap transmission data. The standing caveat is completeness: mapped infrastructure is strong evidence, but an unmapped area means unmapped, not unpowered.
Who reports the grid statistics I see in articles?
The projects that compute them, such as Global Grid with its voltage tables and substation counts for the high-voltage network it draws. This guide attributes such figures to their projects rather than restating them as its own.
Photo credits: Brett Sayles (Pexels); Brett Sayles (Pexels). Photos are served from this site; follow the credit to the library page for the original.