A topographic map looks like a plate of brown spaghetti until the moment it clicks, and then it becomes the most honest picture of land ever printed: every hill, valley, and cliff edge, drawn in lines you can measure. This guide is the click. It teaches the contour system from its one definition outward, through the interval, the spacing rule that reads slope at a glance, the shapes that name landforms, and the arithmetic that turns two points on the map into a gradient you can judge with your legs. It is the depth companion to our wider how to read a topographic map guide, focused entirely on the brown lines and what they claim.
Home / Map Skills for Travel and Outdoors
How to Read a Contour Map: Interval, Spacing, V Rules, and Slope Arithmetic

Photo: Marina Leonova / Pexels
Interactive map
Distance Measurer: Get the Run for Your Slope
Click the two ends of a hillside leg and read the horizontal distance, the run. Divide the elevation change you counted from the contours by this distance and you have the grade, the slope arithmetic this article works by hand.
Total straight-line distance, 0 points
Click the map to start
Distances are great-circle (haversine, mean Earth radius 6,371 km): the shortest path over the surface, not a road or trail distance. Map data © OpenStreetMap contributors.
The One Definition and the Interval
A contour line connects points of equal elevation. Walk along one and you neither climb nor descend; cross one and you have changed height by exactly the map's contour interval, the fixed vertical step between neighboring lines, printed in the map's margin legend. On many hiking maps the interval is 10 meters or 40 feet; on mountain sheets it may be 20 meters or more, chosen so the lines stay readable on steep ground. Every fifth line is typically an index contour, printed bolder and labeled with its elevation, your anchor numbers. Reading heights is then counting: find the nearest index contour, count lines up or down at one interval each, and you know any point's elevation within the interval. Our what is elevation explainer covers what the height is measured from, and how to find elevation gives the digital cross checks.
The Spacing Rule: Slope at a Glance
The single most useful contour skill is reading spacing. Lines close together mean steep ground; lines far apart mean gentle ground; lines evenly spaced mean a uniform slope. A cliff prints as lines merging into one another. A broad plain prints as nearly no lines at all. Before any arithmetic, spacing tells a hiker where the effort lives and tells a route planner where a path can possibly go, because trails, like water tanks and sensible animals, prefer the wide spacings. The measurer above pairs with this directly: measure the horizontal distance between two points on your route, read their elevations from the contours, and you hold both halves of the slope calculation in the next section.
Slope Arithmetic: Two Worked Examples
Slope is rise over run, and the map gives you both. Example one. Two points on a hillside: the lower at 300 meters elevation, the upper at 400 meters, a rise of 100 meters. Measured on the map, they stand 500 meters apart horizontally. The grade is 100 / 500 = 0.20, a 20 percent grade, which as an angle is the arctangent of 0.20, about 11.3 degrees. Hikers feel grades rather than angles: 20 percent is a strenuous but walkable hillside, and sustained grades above about 30 percent are scramble territory for most people. Example two, in feet and miles. A trail climbs 40 feet over half a mile of horizontal distance. Half a mile is 2,640 feet, so the grade is 40 / 2,640, about 1.5 percent, a gentle ramp you would barely notice, the grade of a rail trail. The same arithmetic prices any leg of any route before your legs pay for it, and it feeds directly into effort estimates alongside what is elevation gain, which handles the cumulative climbing a whole trail demands.
The V Rule and the Shapes That Name Land
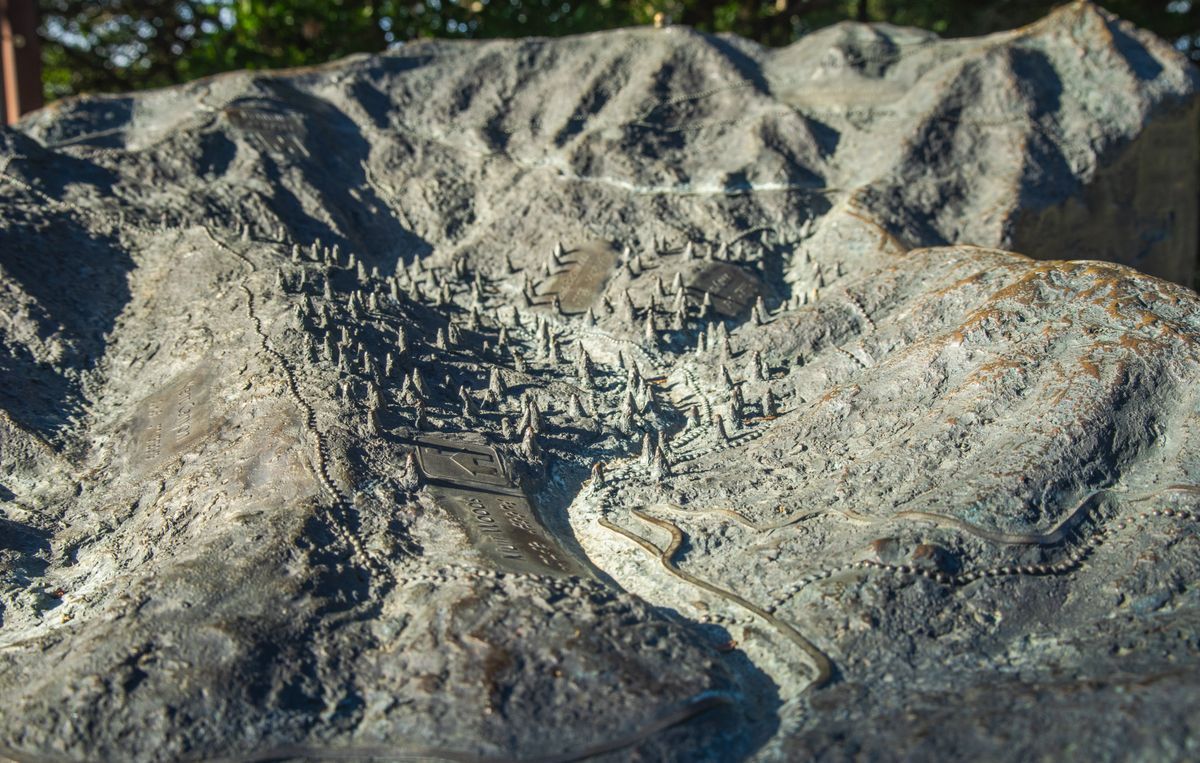
Contours bend where they cross valleys and ridges, and the bend has a direction worth memorizing: where a contour crosses a valley or stream, it forms a V pointing uphill, upstream. Water flows out of the V's open side; height increases toward its point. On a ridge the bend reverses, pointing downhill. This one rule lets you trace every drainage on a sheet and predict where streams, gullies, and wet ground will be, which is half of route finding and most of campsite finding.
The closed shapes complete the vocabulary. A closed loop is a hilltop or a depression; the labels and the surrounding lines tell you which way the height runs, and a loop carrying short tick marks, hachures, pointing inward is a depression, a crater or sink, by convention. Concentric loops are a summit building upward. A saddle appears as an hourglass of contours between two higher areas, the low crossing point of a ridge and the natural place to cross it. Two valleys' V patterns facing each other mark the same pass from either side. These shapes are the same five terrain features the military system teaches, covered from that tradition in our army maps and land navigation guide, and they are the vocabulary in which a contour map describes everything.
The Field Routine: Reading Any Sheet in Five Passes
- Find the interval. Read the margin: the contour interval and the scale. Without the interval, every height on the sheet is unpriced.
- Anchor on index contours. Note the labeled bold lines near your area so counting has a starting number.
- Read the spacing. Scan your route corridor for tight lines, cliffs and steep faces, and wide lines, the gentle options, before committing to a line of travel.
- Trace the water. Follow the V patterns to map the drainages; crossings, campsites, and flood risk all live there.
- Price the legs. For each leg, take the elevation change from the contours and the distance from the scale or the measurer, and compute the grade. Decide with numbers, then walk.
Five passes, a few minutes, and the spaghetti is a landscape with prices on its slopes. Practice on the map of a place you know, comparing the sheet's claims against the ground your memory holds; one verified map teaches the reading faster than ten described ones, and the skill, once held, reads every contour map on Earth, because the brown lines speak one language everywhere.
Reading Water: Drainage, Crossings, and Flood Sense
Contours predict water with an accuracy that feels like local knowledge. Every V pattern is a small watershed announcing itself: the Vs nest, side valleys feeding a main valley whose contours bend in larger Vs, until the whole drainage tree lies visible on the sheet, and with it every stream crossing your route will make, in order. Crossings are where contour reading turns practical: a route crossing the same drainage high near its source wades a trickle, while the map shows the same stream lower, contours wider apart and the blue line bolder, as a genuine ford or a bridge decision. Flood sense is the same reading in negative: where contours spread far apart beside a stream, the ground is a flat valley floor, which is the flood plain, beautiful for lunch and wrong for a tent in heavy weather. Ridges read as the inverse, the drainage divides: the line of high ground separating two V systems is where a route stays dry longest, which is why ridge routes are the old travelers' preference in wet country. Learn to see the tree of Vs and the divides between them, and a contour map stops being a picture of height and becomes a picture of where the water goes, which on real ground is most of what a walker needs to know.
Building an Elevation Profile From the Lines
The profile is the contour map's party trick, turning a route into a graph your legs can read in advance. Lay a straightedge along your route on the sheet and mark every contour crossing, noting each crossing's elevation by counting from the nearest index contour. Transfer the crossings to graph paper at the map's horizontal scale, plot elevation vertically, and connect the points: hills become humps, the saddle becomes the dip between them, and the crux of the day stands out as the steepest segment of the line. Two honest adjustments keep the profile truthful. Exaggerating the vertical scale, which nearly every profile does to make relief visible, also exaggerates apparent steepness, so note the exaggeration on the graph before judging it. And the profile shows the ground along your exact line only; a contour map's promise is that the line ten meters left can differ, which is why profiles plan effort rather than dictate footsteps. Hikers who profile their routes stop being surprised by the third climb of the day, the one that breaks spirits precisely because nobody priced it at the kitchen table.
The Honest Limits of the Brown Lines
Contour literacy includes knowing what the lines cannot promise. A map's contours are only as current as its survey, and terrain moves: landslides redraw hillsides overnight, quarries eat hills between editions, new reservoirs drown valleys the sheet still shows as farms. The interval also sets a floor on honesty: a 10 meter interval cannot show a 4 meter bank, a small cliff, or the levee that decides a flood, so micro terrain below the interval must be read from the ground itself. And contours describe the surface that was measured, which for older sheets may be the surface under a forest that has since been cleared or planted. None of this demotes the system; it assigns it its correct rank, which is the best available prediction, to be confirmed by eyes that know what the lines claimed. Read the map hard, then look at the hill, and let each correct the other.
Related Guides
This guide does not stand alone. The travel and outdoors map skills guides below take up the questions it leads into:
- Contour Lines on a Map: What They Are and the Rules They Never Break: A contour line joins points of equal elevation, and from that one definition every rule of topographic maps follows: lines never cross, spacing is...
- Do You Know How to Read a Map? A 12 Question Self Test With a Full Answer Key: Reading about maps is not the same as reading one, so this article is a test instead of a lecture.
- Best Hiking Map App for Australia: Gaia GPS, Avenza, AllTrails, and the Safety Apps: Australia changes the hiking app question.
Frequently Asked Questions
What is a contour interval?
It is the fixed vertical distance between adjacent contour lines on a map, stated in the margin legend, such as 10 meters or 40 feet. Crossing one line means that much height gained or lost. Every fifth line is usually a bolder, labeled index contour, and counting intervals from the nearest index gives any point's elevation.
How can I tell steepness from a contour map?
By spacing. Contour lines packed close together mark steep ground, lines far apart mark gentle ground, and merging lines mark a cliff. For a number, divide the elevation change between two points by their horizontal distance: 100 meters of rise over 500 meters of run is a 20 percent grade, about 11.3 degrees.
What is the V rule for contours?
Where a contour line crosses a valley or a stream, it bends into a V whose point aims uphill, upstream. Water flows out of the open side of the V. The same bend on a ridge points downhill. The rule lets you trace drainages and predict streams and wet ground anywhere on the sheet.
How do I tell a hill from a depression on a contour map?
Both print as closed loops. A hill's loops increase in elevation toward the center, which nearby index contour labels confirm. A depression's loops carry hachures, short ticks on the inside of the line pointing downhill toward the center. If neither labels nor ticks settle it, check the surroundings: a loop inside a valley system is read in that context.
What is an index contour?
It is every fifth contour line, printed bolder and labeled with its elevation value. Index contours are the reader's anchors: find the nearest one, then count ordinary lines up or down at one contour interval each to price the height of any point on the map.
Can I build an elevation profile from a contour map?
Yes. Draw your route line on the map, mark every point where it crosses a contour, and note each crossing's elevation from the interval counting. Plot distance along the route against those elevations and connect the points: the result is the profile, the route's climbs and descents as a graph, ready to be priced for effort before you walk it.
Photo credits: Marina Leonova (Pexels); Robert So (Pexels). Photos are served from this site; follow the credit to the library page for the original.