Paper maps print their scale as a ratio. Google Maps hides the same idea inside a single number, the zoom level, and never explains it. Once you can translate zoom into meters on the ground, a lot of map behavior snaps into focus: why a screenshot at zoom 15 is useless for a property line, why the scale bar changes length as you pan north, and why "zoom in more" stops helping at the top end. This guide gives the formula, works the numbers honestly, and tours the landmark zooms. It is the digital companion to our paper first map scale guide; the three printed forms of scale are compared in map scale types.
Google Maps Zoom Levels and Scale: What Each Zoom Number Shows on the Ground
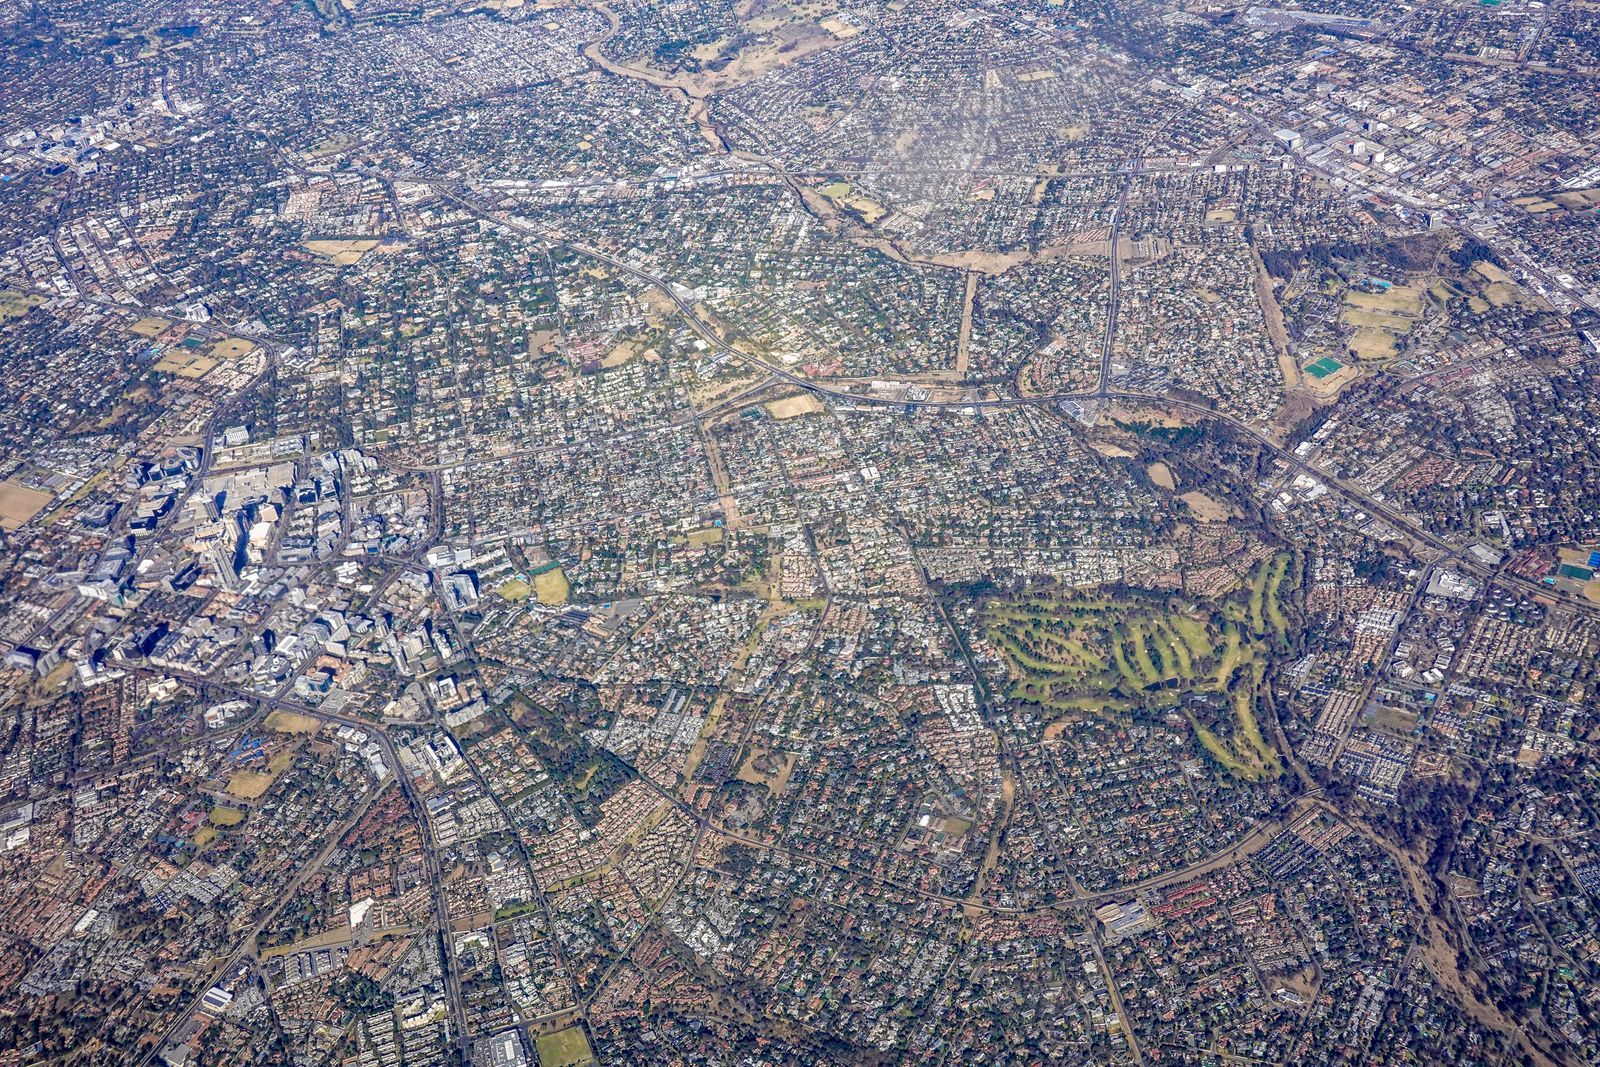
Photo: Magda Ehlers / Pexels
Interactive map
Distance Measurer: What One Zoom Level Sees
Click two points and read the distance between them. At zoom 18 a city block fills the screen and this gap is a short walk; zoom out to 12 and the same gap is a drive across town. The measurer holds the ground truth steady while the zoom changes around it.
Total straight-line distance, 0 points
Click the map to start
Distances are great-circle (haversine, mean Earth radius 6,371 km): the shortest path over the surface, not a road or trail distance. Map data © OpenStreetMap contributors.
The One Formula Behind Every Zoom
Google Maps builds the world from square tiles, 256 pixels on a side, in the Web Mercator projection. At zoom level 0 the entire world is one tile. Every step up doubles the tiles in each direction and halves the ground each pixel covers. The ground size of one pixel, in meters, is:
meters per pixel = 156543.03392 x cos(latitude) / 2^zoom
The constant is the size of a pixel at zoom 0 at the equator, and the cosine term is the Mercator correction: the same zoom shows less ground per pixel as you move toward the poles, because the projection stretches high latitudes. Two consequences follow immediately. Zoom is latitude dependent, so any table of zoom scales must name its latitude. And zoom is continuous in effect but integer in steps: the app animates smoothly, but the tile pyramid underneath doubles in whole steps, which is why detail arrives in doublings, not gradually.
Worked Numbers: The Equator and 40 Degrees
At the equator, the formula gives: zoom 0, about 156,543 meters per pixel (the whole world on one screen); zoom 5, about 4,892; zoom 10, about 153 meters per pixel (a region view); zoom 15, about 4.78 meters per pixel (a neighborhood); zoom 18, about 0.60 meters per pixel (individual buildings and cars); zoom 20, about 0.15 meters per pixel (a desk sized pixel). At 40 degrees latitude, multiply by cos(40 degrees), about 0.766: zoom 15 becomes about 3.66 meters per pixel and zoom 18 about 0.46. To turn meters per pixel into the ratio language of paper maps, multiply by your screen's pixel density factor; on a standard 96 DPI display the multiplier is about 3,779, so zoom 15 at the equator reads as roughly 1:18,000, close to a detailed city map, and zoom 18 as roughly 1:2,250, larger scale than almost any printed street map. Change the screen and the ratio changes, which is exactly why the ratio is the wrong language for screens, as the next section argues.
A Tour of the Landmark Zooms
Zoom 3 to 4 is the continent view: countries whole, cities as dots, the level for weather maps and flight thinking. Zoom 6 to 7 is a state or small country; highways appear as a network. Zoom 10 frames a metro area: suburbs distinguishable, the ring road a clear loop, and the scale where our how to measure distance on a map app workflows plan regional trips. Zoom 12 to 13 is the city view, arterial roads named, neighborhoods legible. Zoom 15 is the neighborhood: side streets, building footprints in many cities, the working zoom for walking directions. Zoom 17 to 18 is the street level of the base map: individual buildings, driveways, and parked cars in the imagery, the practical top for the map layer in most places. Zoom 19 to 21 exists mainly in satellite imagery in well covered areas; beyond the data's real resolution the app simply enlarges pixels, which is why the last steps can look soft. Sources disagree about the exact maximum zoom because it genuinely varies by place and layer, so this guide prints no single cap: expect about 21, sometimes one step more or less, and judge by whether new detail actually appears.
Why the Scale Bar Is the Only Honest Ruler on Screen
Google Maps shows a scale bar (enable it permanently in Settings, or watch it appear as you zoom), and on a screen it is the only scale statement that stays true. A ratio assumes a fixed physical size for a pixel, but your screen might be a phone at arm's length, a laptop, or a projector wall, all showing the same zoom at wildly different physical sizes. The bar solves this by measuring itself against the current view at the current latitude: it stretches and shrinks as you pan toward the poles, quietly applying the cosine term from the formula for you. The craft habit is simple: quote distances from the bar, or measure with the app's own tool, and never quote a ratio computed on your screen as if it were a property of the map. The measuring workflow itself is in how to measure distance on a map for paper and screen alike.
Zoom, Resolution, and the Screenshots Trap
A screenshot freezes pixels, not ground truth, and zoom decides what the freeze is worth. At zoom 15 a building is a few dozen pixels and its outline is approximate; property, legal, and survey questions need sources with known accuracy, not a harder zoom. Conversely, for embedding maps in documents, zoom is a composition tool: choose the level where the subject and its context balance, zoom 15 for a venue in its neighborhood, zoom 12 for a venue in its city, and let the scale bar ride along in the corner so readers can judge distances themselves. The related conversion craft, turning a digital view into a correctly scaled image, is what google map to image covers. And if your real question is the paper kind, converting between a printed ratio and a measured distance, how calculate map scale works those problems directly.
Zoom in the Other Apps, and the Satellite Ceiling
Google Maps is not the only place zoom numbers rule. OpenStreetMap's own site uses the same zoom scheme (the tile pyramid is a shared standard, which is why a zoom 14 view frames roughly the same ground in both), and most web map libraries speak it natively; our openstreetmap vs leaflet comparison explains the tile layer both stand on. Where the apps differ is the ceiling: satellite imagery resolution is set by the satellites and aircraft that shot it, not by the interface, so the top zooms exist only where high resolution coverage was flown, dense cities first, and the same zoom over rural ground may simply stop earlier or go soft. The practical reading skill is to treat the last zoom step with suspicion: if stepping in adds no new detail, you have passed the data's resolution and are looking at enlarged pixels, however crisp the interface feels. Back out one step for the honest view, and quote that zoom when you describe what the imagery can and cannot show.
A Pocket Table: Zoom to Ground, Ready to Quote
For quick reference, the formula's answers at the zooms people actually ask about, computed for the equator and for 40 degrees north or south, in meters per pixel: at zoom 10, 153 and 117; at zoom 12, 38.2 and 29.3; at zoom 14, 9.55 and 7.32; at zoom 15, 4.78 and 3.66; at zoom 16, 2.39 and 1.83; at zoom 18, 0.60 and 0.46; at zoom 20, 0.15 and 0.11. Read the table with the screen size in mind to turn it into vision: a phone screen about 400 pixels wide at zoom 15 shows roughly 1.9 kilometers of equator, or 1.5 kilometers at 40 degrees, which is why a neighborhood fits and a city does not. The same arithmetic explains the satellite ceiling from the last section: at zoom 20 a pixel claims 15 centimeters of ground, finer than most imagery was ever captured at, so the top steps in most places are the map politely enlarging what it has. Quote the zoom and the latitude together whenever you quote a scale, and your statement stays true on any screen it is read on.
Related Guides
If this page answered part of the question, these map app guides cover the rest of the same ground:
- Google Maps: How to Scan a QR Code (and How to Make One for Your Location): Google Maps has no QR scanner built in, and it does not need one.
- How to Report a Road Closure on Google Maps: In Navigation, in Crisis, and for Good: Reporting a road closure on Google Maps is three different jobs wearing one name: an incident report filed from inside navigation for the closure...
- Google Maps Property Lines: What Those Lines Are and Where Real Boundaries Live: Google Maps has no property line layer, and the thin parcel-like lines you can sometimes see at high zoom are not survey data and carry no legal...
Frequently Asked Questions
What is the maximum zoom on Google Maps?
It varies by place and by layer, which is why sources disagree. Expect about zoom 21, occasionally a step more or less, with satellite imagery often reaching one level beyond the street map. Past the data's true resolution, extra zoom only enlarges pixels, so the practical maximum is where new detail stops appearing.
How many meters is one pixel at zoom 15?
About 4.78 meters per pixel at the equator, and about 3.66 at 40 degrees latitude, from the formula 156543.03392 x cos(latitude) / 2^zoom. The latitude term is why no single answer exists: the same zoom covers less ground per pixel away from the equator.
What zoom level shows a house?
Individual buildings become clear at zoom 17 to 18 on the base map, where a pixel covers roughly half a meter. Satellite imagery at zoom 19 to 20 shows roofs, cars, and garden detail in well covered areas. For anything legal about a property, use surveyed sources, not any zoom of a web map.
Why does the scale bar change length when I pan?
Because of the Mercator projection's latitude effect, the same cosine term in the zoom formula. At higher latitudes the projection stretches the ground, so a fixed ground distance takes more pixels, and the bar redraws itself to stay truthful for the place on screen.
How does zoom relate to paper map scale?
Loosely, through your screen. On a 96 DPI display, zoom 15 at the equator is about 1:18,000 and zoom 18 about 1:2,250, comparable to detailed city and street maps. Change the display and the ratio changes while the zoom stays the same, which is why screens quote zoom and bars, and paper quotes ratios.
Photo credits: Magda Ehlers (Pexels); Jhovani Morales (Pexels). Photos are served from this site; follow the credit to the library page for the original.