Most people glance at the traffic layer the way they glance at weather: red is bad, green is fine, drive accordingly. That reading misses almost everything the layer knows. The colors are relative, not absolute; two of the marks on the map mean entirely different things that look similar at a glance; and the layer has a second mode, Typical traffic, that is more useful for planning than the live view is. This guide treats the traffic layer as the instrument it is: how to switch it on, how to read every mark it makes, where its data comes from, and when to distrust it.
Google Maps Traffic: Read the Colors, the Closures, and Typical Traffic Right
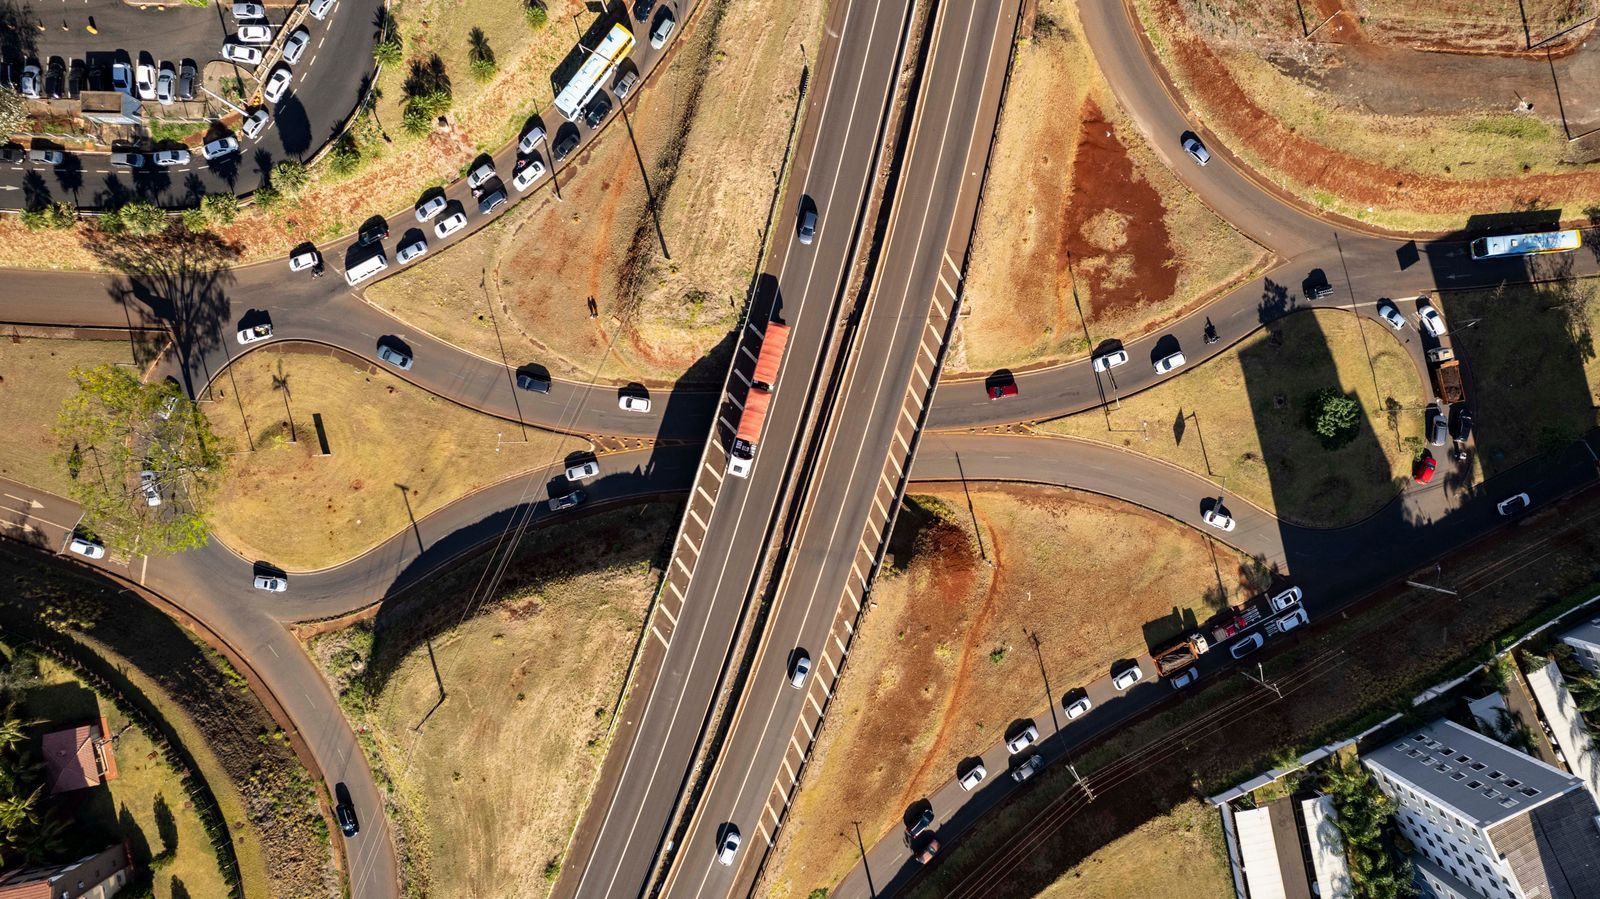
Photo: Rodolfo Gaion / Pexels
Interactive tool
Read the Layer Right: The Traffic Checks
Check off each step as you finish it. Your progress stays on this page.
0 of 7 complete
0% done
Turn the Traffic Layer On
On the phone app, tap the layers icon (the stacked diamond at the top right of the map) and choose Traffic under Map details. The road network lights up in color and stays lit as you pan and zoom. On desktop, hover the Layers panel at the bottom left and select Traffic. The layer is a property of the base map, not of a route: it colors every road Maps knows about, whether or not you are navigating. Turn it on before you ask for directions and the route choices Maps offers will already be priced against the conditions you can see. Turn it on while navigating and it explains, after the fact, why the blue line bends the way it does.
The Colors: A Comparison, Not a Speedometer
The single fact that changes how you read the layer: the colors compare the live speed on a road with that road's normal speed at that time of day. They do not report an absolute speed, and the same color means different speeds on different roads.
| Color | What it means | What it feels like |
|---|---|---|
| Green | Traffic is flowing at or near the road's normal speed | No delay worth planning around |
| Orange | Traffic is slower than normal | A moderate slowdown; the road still moves |
| Red | Traffic is much slower than normal | A serious slowdown for that road |
| Dark red | Traffic is crawling relative to normal | The worst conditions the layer shows |
Because the scale is relative, a red residential street may still be moving faster than a green motorway is not; the red means the street is far below its own usual pace. A short red segment on a fast road can cost more minutes than a long orange one on a slow road. Read the color as a verdict on the road's health, then let the route's arrival estimate do the arithmetic. Google's own description of the feature is built on exactly this comparison: conditions now against conditions normally, which is why a road can show red at midnight after an incident even with only a handful of cars on it.
Incidents, and the Dotted Red That Means Closed
Layered over the colors are incident marks: icons for crashes, roadworks, and hazards, reported from official feeds and from drivers. Tap one and Maps shows what it knows, including when the report arrived. Treat a fresh icon as a strong signal and an hours-old one as a rumor; incidents clear faster than their icons sometimes do.
One mark deserves its own rule. A dotted or dashed red line is not heavy traffic. It marks a road that is closed: no through passage at all. Drivers misread it as the darkest grade of congestion and plan to crawl through, then meet a barrier. If your route crosses a dotted red segment, the road is shut, and the only question is which detour Maps or you choose instead. Solid dark red means crawling; dotted red means closed. Learn that one distinction and the layer has already paid for this article.
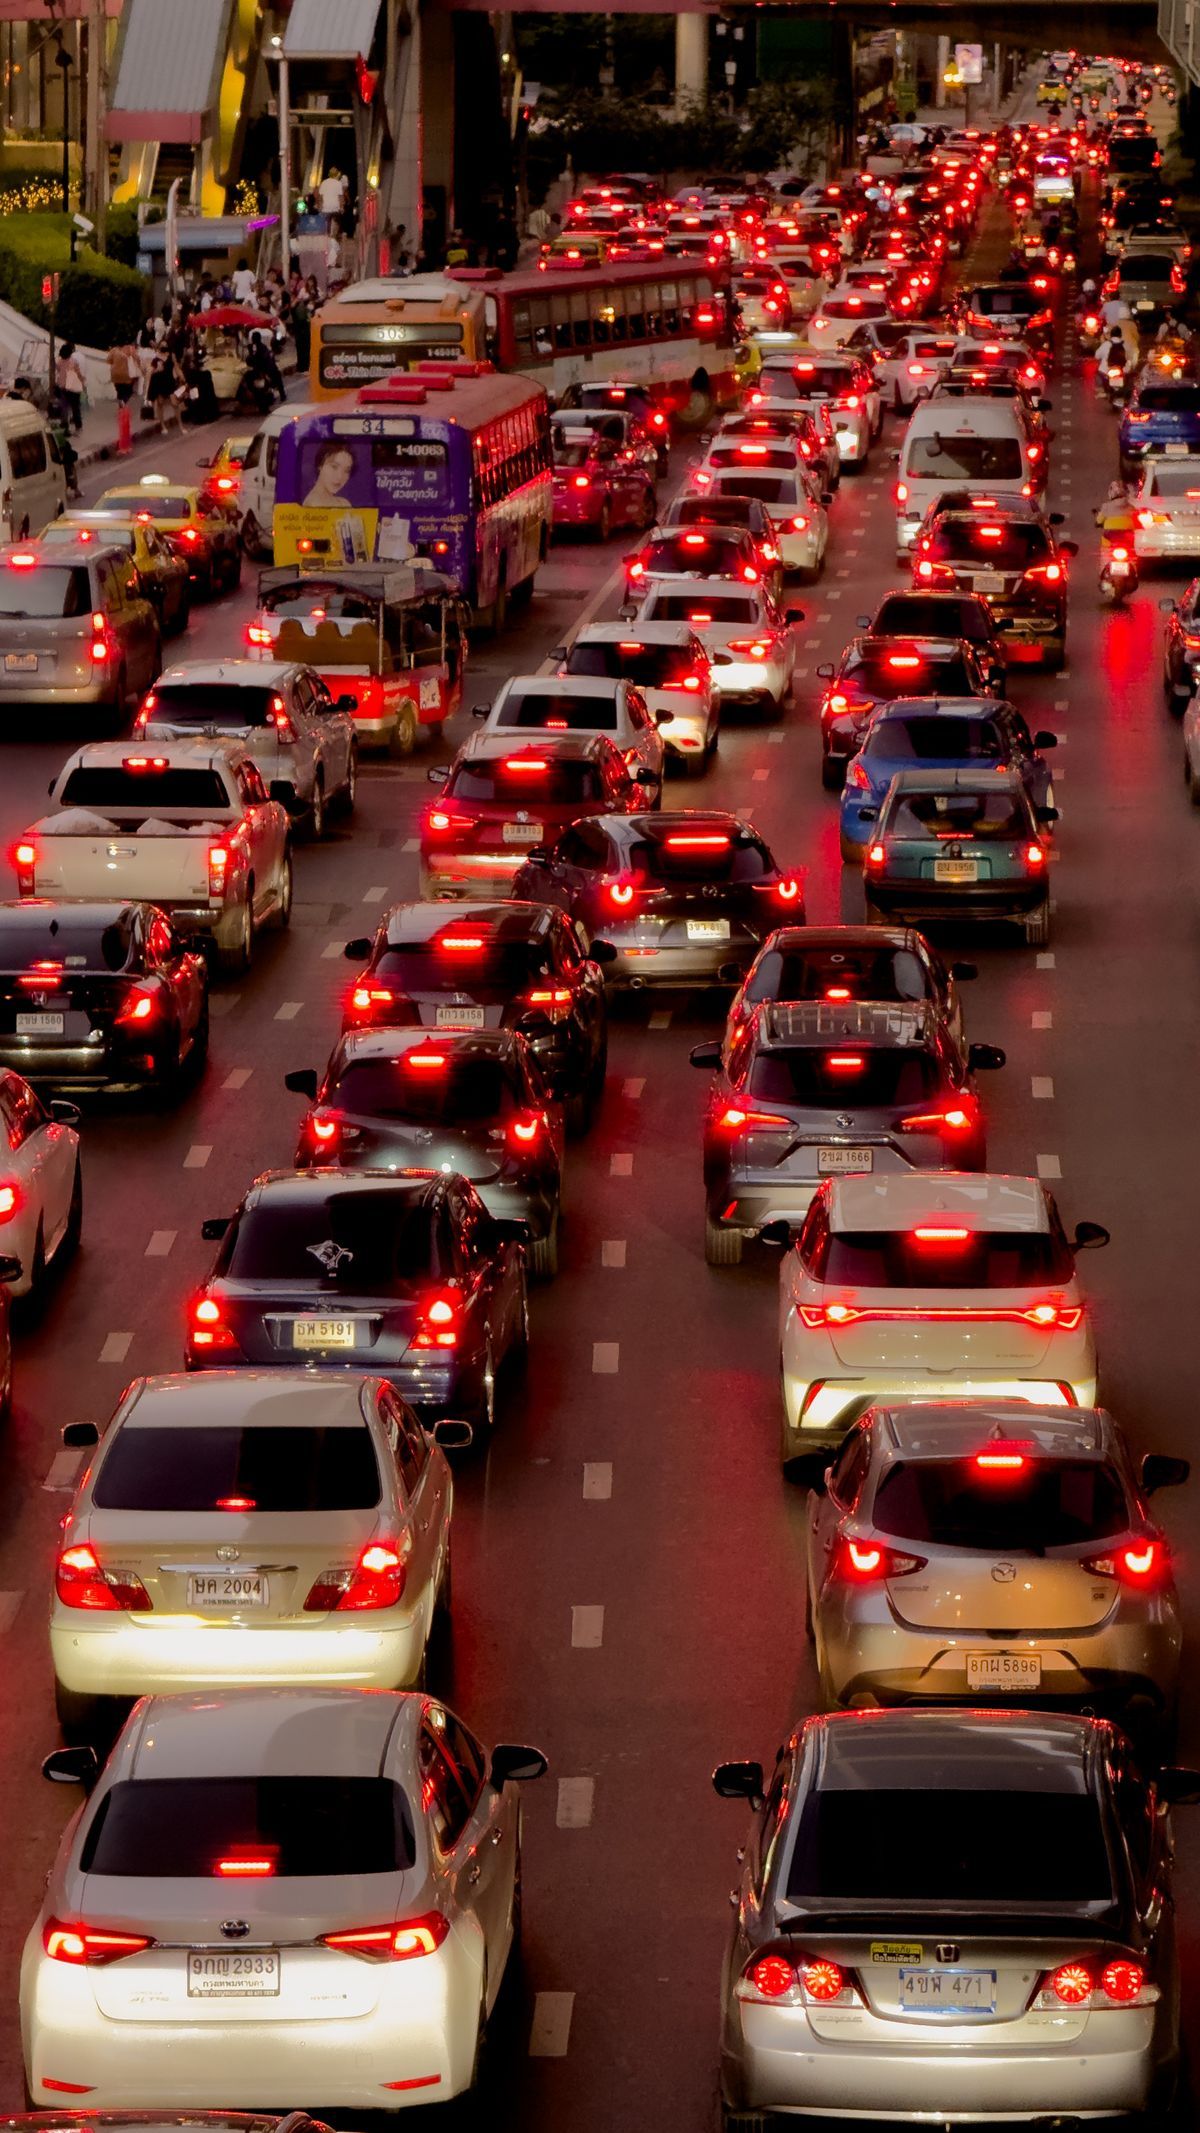
Typical Traffic: The Planning View
The live layer answers "what is happening now." Typical traffic answers the question planners actually ask: "what is this road usually like at 8 in the morning on a Tuesday?" On desktop, with the traffic layer on, switch from Live to Typical traffic and set the day and time. The colors repaint themselves as the historical pattern for that slot, built from long-run observations of the same roads. Use it to choose a departure time the night before, to sanity-check a commute before accepting a job or a lease, and to learn a new city's rhythm: which arteries clog first, which stay green, when the evening peak really releases. Typical traffic is a pattern, not a promise; a crash tomorrow morning will not be in it. But for the recurring journeys that make up most driving, the pattern is the better guide, and it is the half of the feature most users never find.
Where the Data Comes From
The live colors are computed from aggregated, anonymous location and speed reports from phones moving along the roads, combined with incident data from official sources and driver reports. Three consequences follow. First, the layer is only as good as the flow of phones: a road full of drivers lights up precisely, while a rural road with two cars an hour may show green simply because nobody is reporting from it, so absence of red is not proof of absence of trouble. Second, the data is live but not instant; a jam takes minutes to paint as phones slow inside it, and minutes to clear from the map after it dissolves. Third, your own phone contributes when you use Maps with location on, anonymously and in aggregate, which is the bargain the whole system runs on. Understanding the source explains the failures: the phantom jam on a frontage road (phones on the parallel motorway bleeding onto the wrong line) and the unpainted closure on a country lane are both what this data pipeline would predict.
Where Traffic Simply Is Not Available
The traffic layer does not cover the world evenly. Some countries and regions have no live traffic in Maps at all, some have it only in major cities, and some roads inside covered areas never carry enough reporting phones to earn a color. The honest signal is the map itself: if the roads around you stay uncolored with the layer on, you are in a gap, and the correct response is to navigate by distance and local knowledge rather than to trust the green of a neighboring city bleeding into your expectations. Coverage grows steadily as phone density grows, so a gap you found last year is worth retesting. But plan any trip through thinly covered country the old way, and treat the layer as a bonus when it appears.
Reading Traffic Like a Driver, Not a Passenger
A few habits separate people who use the layer from people who merely look at it. Check the layer before choosing a departure time, not after choosing a route; ten minutes of delay at the kitchen table is free, and the same ten minutes bought by leaving earlier is the cheapest travel upgrade there is. When Maps offers a faster alternative mid-journey, glance at the layer to see whether the saving is a real open road or a rumor from three phones. Distrust a sudden dark red segment that appeared in the last minute on an otherwise flowing road until an incident icon or a second minute confirms it. And on a long trip, re-check at every stop: the layer you read at departure describes a world that is already hours old by the time you reach the far half of the drive. The drivers who arrive calm are not the ones with the best app. They are the ones who read the comparison the colors actually make, know the dotted red rule, and plan with Typical traffic the night before.
The Route Line Is the Layer, Summarized
Once you navigate, the layer folds itself into your route: the blue line ahead of you is recolored in the same traffic colors, so the road you are actually on shows its own health without a detour into the layer view. Read it together with the arrival estimate, because the two are the same data at different zoom levels. The colored line tells you where the delay lives; the estimate tells you what it costs. When the line ahead turns red two junctions from now, that is the moment an alternate route is worth its detour, not when you are already parked inside the jam. When the whole line is green except one short orange pinch, the estimate barely moves and the calm choice is to stay. Drivers who only watch the clock number miss the geography; drivers who only watch the colors miss the price. The instrument panel gives you both, and the skill is reading them as one statement.
Habits for Commuters: Learn Your Own Roads
The layer's relative scale rewards local knowledge. A commuter who watches the same corridor for a month learns what its colors are worth in minutes: this orange is five minutes, that red is twenty, the dark red at the bridge means the accident lane is closed again. No documentation can give you those conversions, because they depend on the road's length, its alternatives, and your own tolerance. Build them deliberately. Note the color when you leave and the delay when you arrive, a handful of times, and the layer becomes calibrated to your life. This is also the honest way to settle arguments about which app reads traffic better: not a single dramatic jam, but a month of your own corridor, scored. Our comparison of Apple Maps and Google Maps traffic accuracy takes up exactly that question with the two systems side by side.
Related Guides
If this page answered part of the question, these map app guides cover the rest of the same ground:
- Google Maps Route Planner: Build the Route, Then Let Traffic Price It: The planner that consumes what this layer reports, with multi-stop ordering and route options.
- How to Find Alternate Routes in Google Maps: The Gray Lines, Explained: When the layer says your road is red, the gray alternatives are the way out.
- Apple Maps vs Google Maps Traffic Accuracy: Which Jam Is Real?: The same roads read by two systems, and why they disagree.
- How to Use Google Maps: The Complete First Trip: The full app tour for readers starting from the beginning.
Frequently Asked Questions
What do the traffic colors in Google Maps mean?
They compare live speed on each road with that road's normal speed at that time of day. Green means flowing normally, orange means slower than normal, red means much slower, and dark red means crawling relative to the road's usual pace. They are not absolute speeds, so the same color means different speeds on different roads.
What does a dotted red line mean in Google Maps?
A dotted or dashed red line marks a closed road, not heavy traffic. Solid dark red means traffic is crawling; dotted red means there is no through passage and you need a detour.
What is Typical traffic in Google Maps?
It is the historical pattern view of the traffic layer, available on desktop. Instead of live conditions, it shows what each road is usually like at the day and time you select, which makes it the right tool for planning a departure the night before.
Where does Google Maps get its traffic data?
Mainly from aggregated, anonymous location and speed reports from phones traveling the roads, combined with incident feeds from official sources and reports from drivers. Roads with few reporting phones may show no color even when something is wrong.
Why does my area show no traffic colors?
Live traffic is not available in every country or region, and within covered areas it needs enough phones on a road to compute conditions. If roads stay uncolored with the layer switched on, you are in a coverage gap; navigate by distance and local knowledge there.
Photo credits: Rodolfo Gaion (Pexels); Phisek Srinamphon (Pexels). Photos are served from this site; follow the credit to the library page for the original.