Most drivers meet Google Maps traffic by accident, as a red smear that appears under their route while they are already moving. That is the worst moment to learn what the colors mean. Traffic in Google Maps is a proper layer with its own switch, its own color language, and, on desktop, a second mode that shows the traffic a road usually carries at a chosen day and hour rather than the traffic it carries right now. Read properly, it answers three different questions: is my route slow at this moment, is this road normally slow when I plan to use it, and where exactly does the delay live. This guide walks through all three, on the phone and on the computer, and ends with the reading habits that keep the layer from misleading you.
How to View Traffic in Google Maps: The Live Colors, Typical Traffic, and Reading a Route Before You Drive
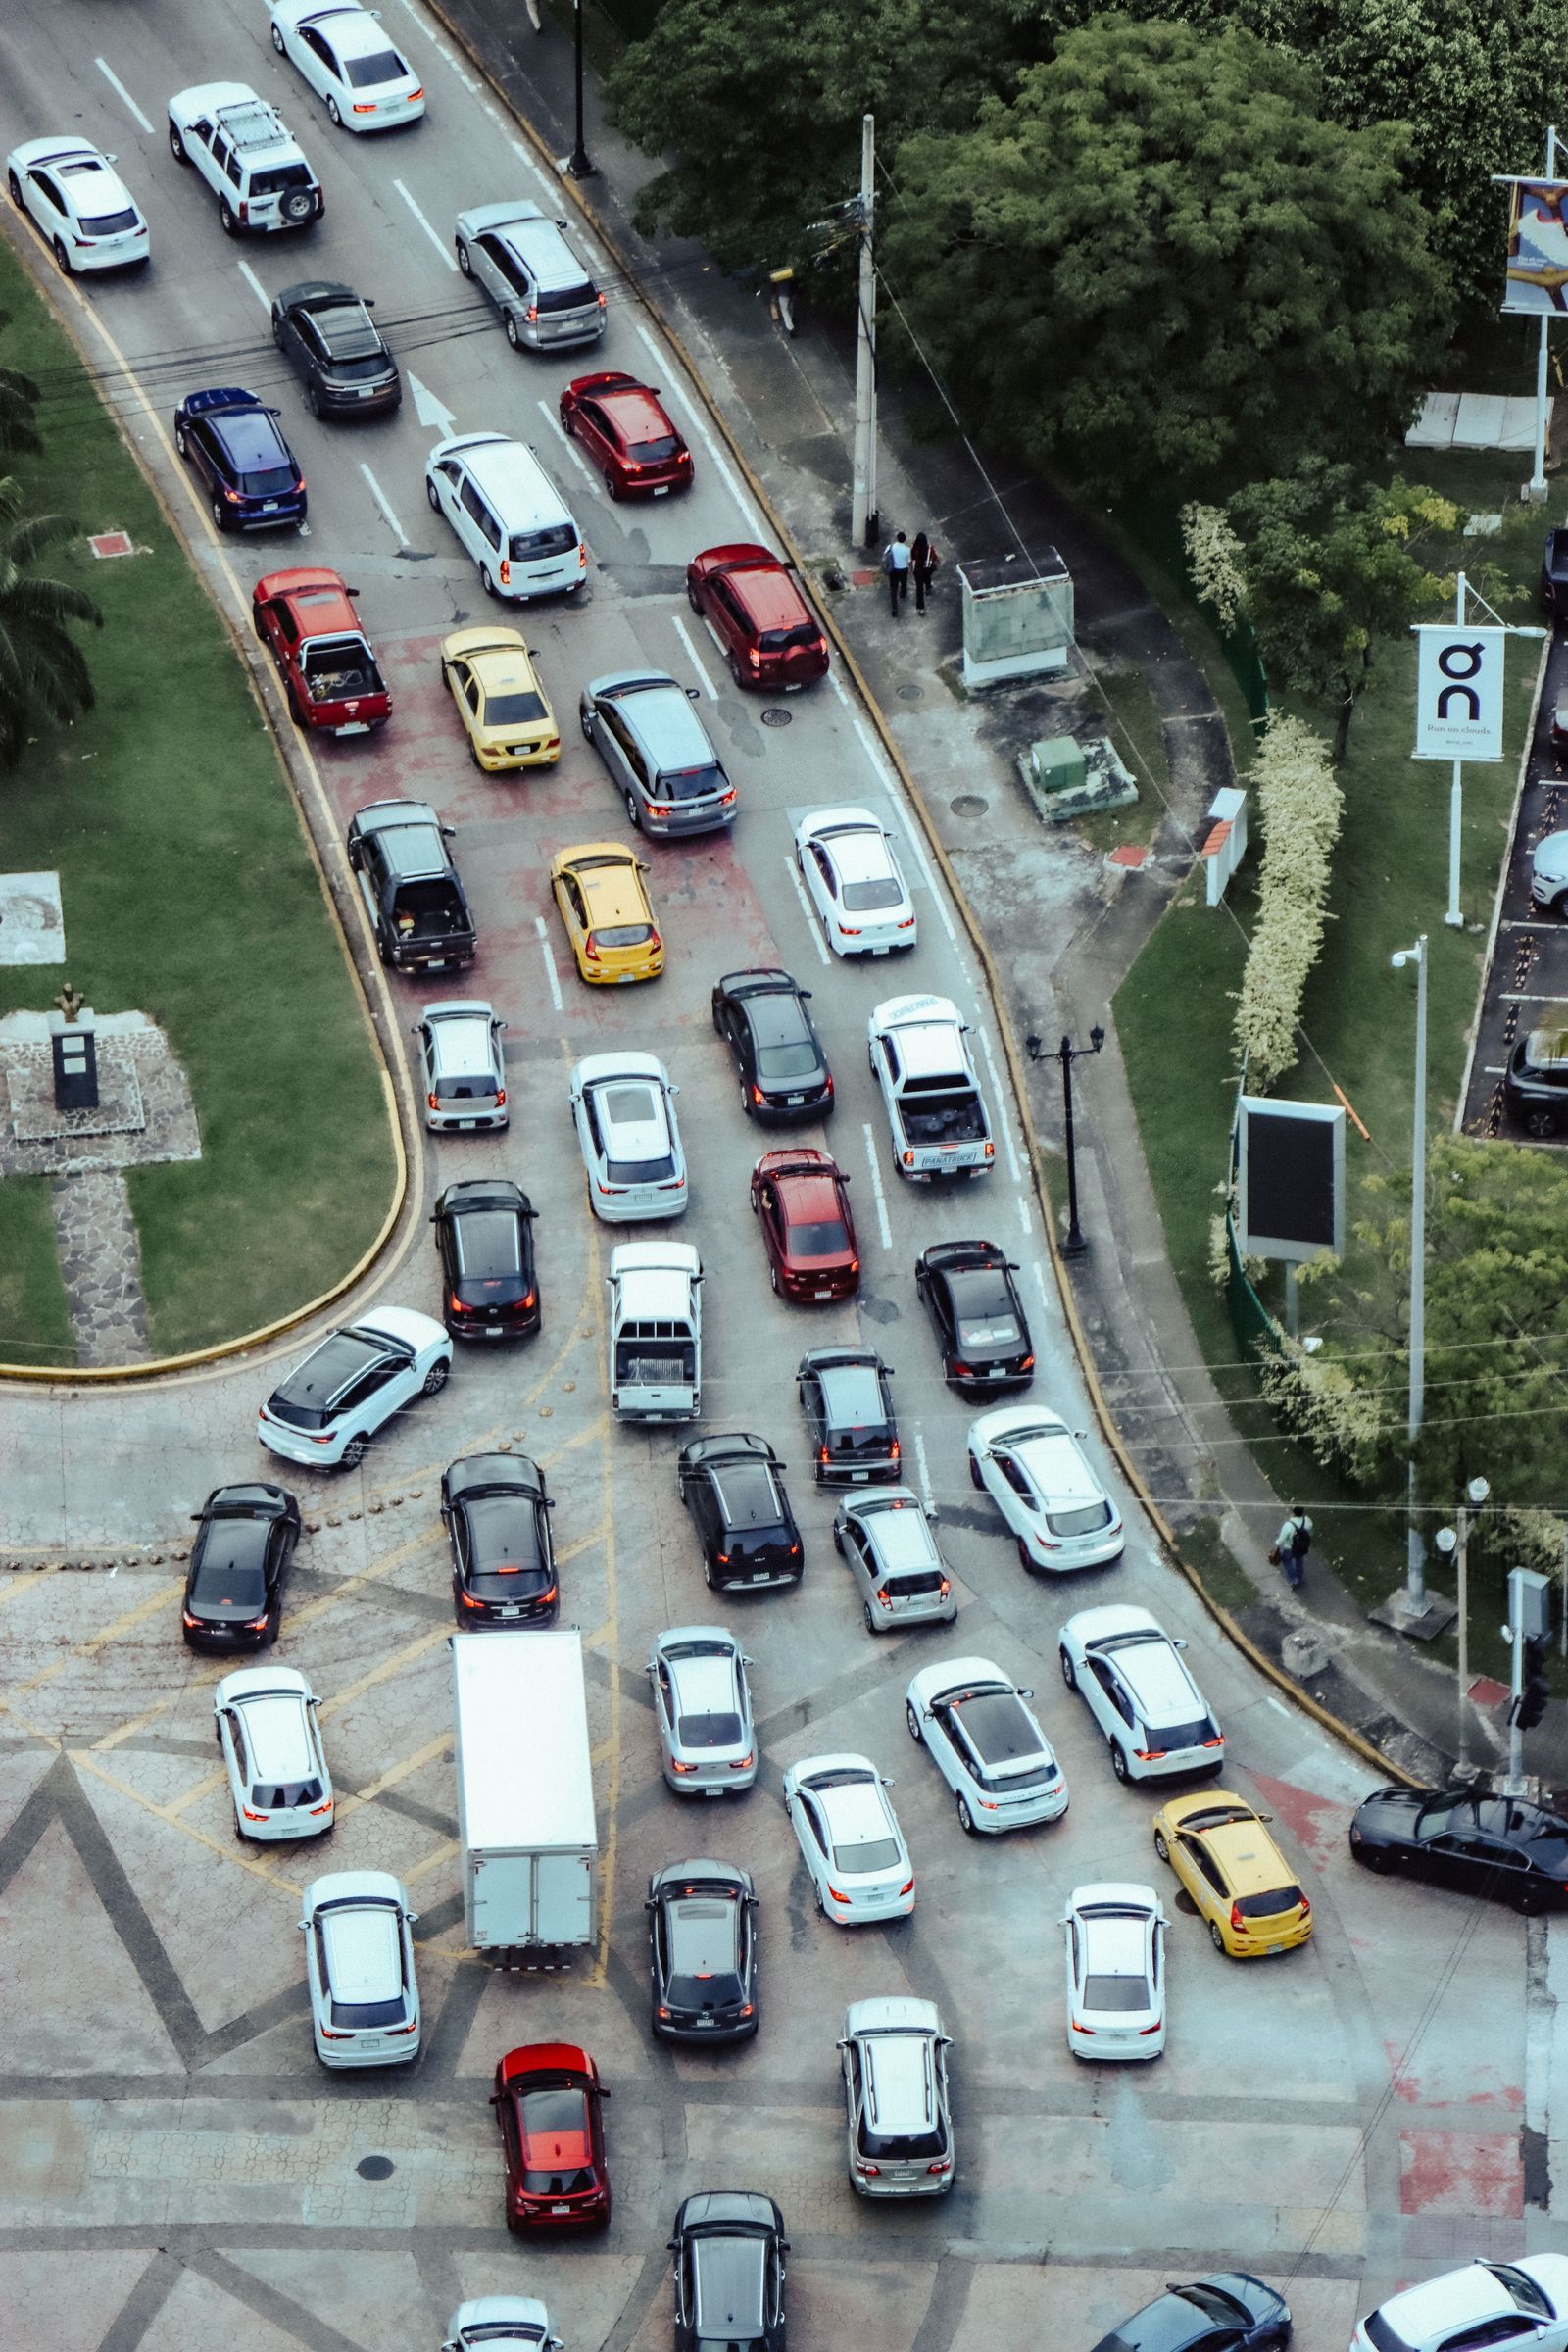
Photo: Luis Quintero / Pexels
Interactive tool
Read the River of Cars: The Traffic Layer Checklist
Check off each step as you finish it. Your progress stays on this page.
0 of 7 complete
0% done
Turn the Layer On: Phone and Desktop
On the phone, open Google Maps and tap the Layers button, the diamond-shaped stack icon near the top right of the map. A panel of map details opens, and Traffic is one of the choices. Tap it and the road network takes on color wherever Google has data. The layer stays on while you browse, search, and preview routes, and you tap it again in the same panel to turn it off. On desktop, open Google Maps in the browser, click the Layers control at the bottom left of the map, and choose Traffic from the details that appear. The desktop version matters because it carries the feature the phone buries: in the same panel area you can switch between Live traffic and Typical traffic, which is the planning view described below. Two habits make the layer useful instead of decorative. First, turn it on before you ask for directions, so the route preview you read next is already painted. Second, learn to read it at two zooms: zoomed out for the corridor question, zoomed in for the street question. The layer rewards both and lies a little at every zoom in between.
What the Colors Actually Mean
The scale has four working colors and one important absence. Green means traffic is moving at or near the normal speed for that road: no meaningful delay. Orange means the flow is slower than normal, the kind of slowdown that adds minutes rather than ruining days. Red means heavy congestion, and dark red, the deepest shade, means the worst of it: crawling or stopped traffic on that stretch. The colors describe speed relative to what that road usually manages, which is why a red farm road and a red freeway are different emergencies wearing the same paint. The fifth state is the one people misread most: a road with no color at all is not a promise of clear driving. It usually means Google has too little data for that road at that moment, which happens on minor rural roads, very late at night, and in whole regions where the layer is thin. Treat gray as unknown, not as green. Our comparison of Apple Maps vs Google Maps traffic accuracy digs into where each service gets this data and why the same street can be painted differently by the two apps.
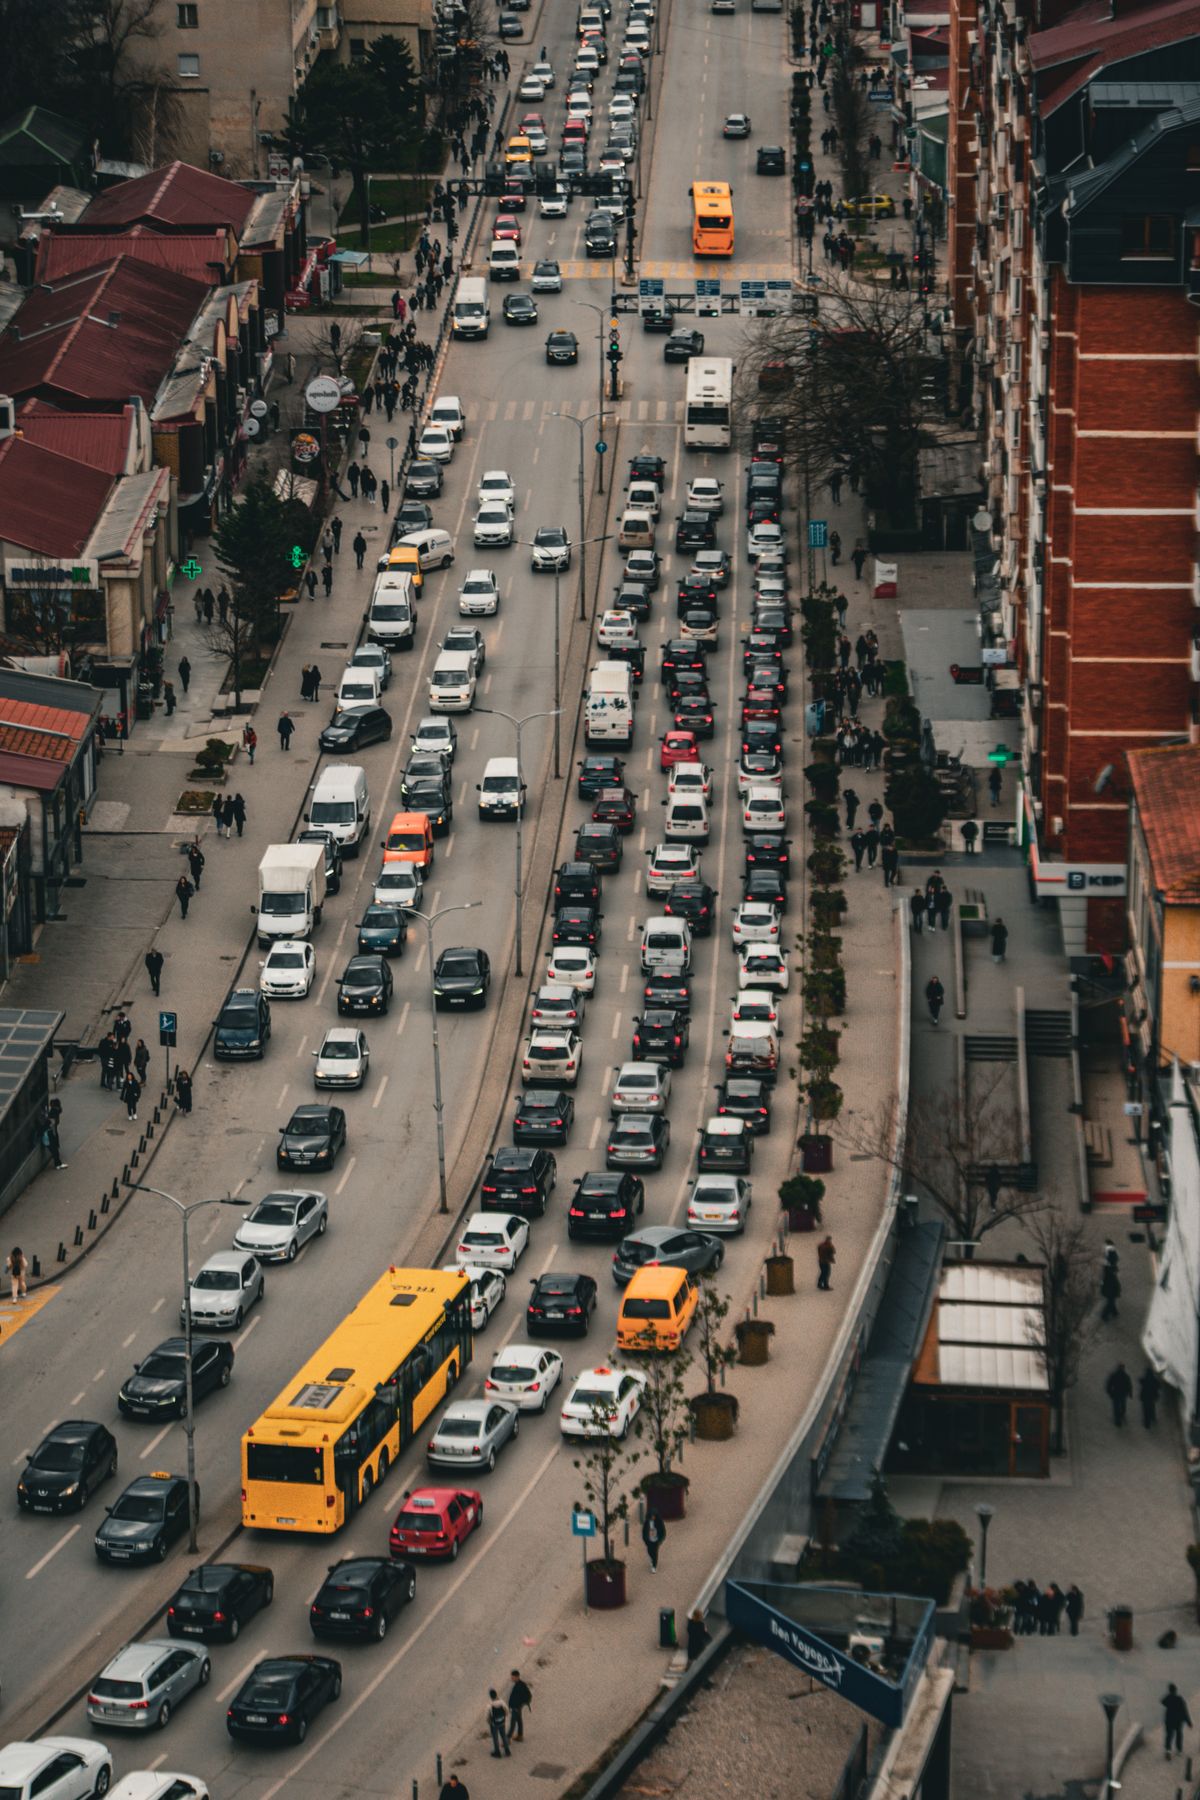
Live Traffic vs Typical Traffic
Live traffic is the layer's present tense: conditions built from the movement of phones on the road right now, refreshed continuously. It answers the question you ask at the curb: if I leave now, what will I hit. Typical traffic is the past tense used as a forecast. On desktop, the traffic panel lets you choose Typical and then pick a day of the week and a time of day, and the map repaints itself with the congestion that is normal for that slot: the school-run orange on a Tuesday at 8 in the morning, the empty green of the same road on Sunday at dawn. Typical traffic is the right tool for planning a trip you will take later, choosing a departure time for a weekly commute, or checking whether a route is chronically bad rather than bad today. Its limit is built into its name: typical cannot know about today's crash, roadworks, or match day crowd. The disciplined routine uses both in order. Plan the week with Typical, then check Live in the last ten minutes before you leave, because the plan deserves a forecast and the departure deserves the facts.
Traffic Inside the Route Preview
The most useful traffic view in Google Maps is not the open map at all. It is the route preview. When you ask for directions, the suggested route is drawn in the same traffic colors along its length, and the alternate routes, the gray lines our guide to alternate routes explains, carry their own coloring where they differ. Read the preview in three passes. First, the total time and its range, which already includes the traffic Google knows about. Second, the color pattern along your blue line: a route that is green with one short red knot near the end is a different trip from a route that is orange for its whole length, even when the totals match, because the knot can clear and the orange cannot. Third, the alternates: a gray route that is mostly green and four minutes longer on paper often beats a red blue route whose estimate assumes the jam behaves. When the preview shows a closure or a crash icon, that is data too, and if you are the one who finds a road blocked that the map does not know about, our guide to reporting a road closure covers how to tell Google and everyone behind you.
Street Scale vs Corridor Scale
New readers of the layer make one consistent mistake: they zoom into a single red street and conclude the whole trip is doomed, or they stay zoomed out, see a green region, and drive into a red neighborhood. Traffic has a scale problem because congestion is local. A corridor, the freeway across town, the bridge, the one road into the valley, is read zoomed out, where the question is whether the line as a whole is moving. A street is read zoomed in, where the question is which junction, school gate, or set of lights is generating the color. The two readings answer to different decisions. Corridor red means leave earlier, take the alternate, or do not go. Street red inside a green corridor usually means one bad node you will pass in two minutes, and rerouting around it can cost more than enduring it. Before you react to any color, ask which scale you are looking at and which decision it can honestly support. The speed limit display pairs well with this habit: color tells you how the road is flowing, the posted limit tells you what it allows, and neither one replaces the signs outside the windshield.
Incidents, Closures, and the Icons Between the Colors
Color is only half the layer. On top of the painted roads, Google Maps places incident markers: crashes, roadworks, lane closures, and full road closures, each with its own icon, and tapping one usually tells you when it was reported and, for closures, how long it is expected to last. These markers come from official feeds and from drivers reporting what they pass, which is why a fresh crash can appear within minutes and why a stale roadworks icon can outlive the cones. Read the two systems together. Color tells you the consequence, the actual slowing of traffic. Icons tell you the cause, or at least the claimed one. A red stretch with a crash icon at its head is a queue with a reason and an unknown end. A red stretch with no icon at all is often just volume, the predictable weight of everyone leaving at once, and it will melt on schedule. Roadworks icons deserve special respect on trips you repeat: they mark the delays that will still be there next week, unlike today's crash. And when the map shows a closure your own eyes contradict, trust your eyes and the barriers, then report what you found once you are safely past it, because the next driver's layer is only as honest as the last driver's report.
When the Map Shows Nothing
Sometimes the layer paints nothing at all, and the honest reading is that the map has gone quiet, not that the world has emptied. Small roads in sparse areas may never carry color because too few phones travel them for Google to judge their speed. New developments can sit uncolored until the data catches up with the asphalt. Whole countries and regions have thinner traffic coverage than the big metropolitan networks, which is why the same app feels omniscient in one city and vague in another. In those places the layer degrades gracefully into a plain map, and your tools become the older ones: the route's total time, which still reflects what data exists, local knowledge, and the departure buffer you give any trip whose road you cannot watch. An uncolored map is also a reminder of what the colors are: not sensors in the road, but the aggregated movement of other people's phones, with all the blind spots that implies. Read the layer as a strong witness with known gaps, and it will rarely steer you wrong.
Related Guides
Readers working through this topic usually need its closest companions too. These map app guides cover the neighboring ground:
- How to Find Alternate Routes in Google Maps: The Gray Lines, Explained: The gray lines beside your blue route are real offers with real tradeoffs, and reading their colors is how you choose between them.
- Apple Maps vs Google Maps Traffic Accuracy: Whose Congestion Data and ETAs to Trust: Where each service gets its congestion data, and why the same street can wear different colors in the two apps.
- Google Maps Speed Limit: The Two Switches, the Rollout, and Why the Posted Sign Wins: The other number on the navigation screen, what controls it, and why the sign outside always outranks it.
- How to Report a Road Closure on Google Maps: In Navigation, in Crisis, and for Good: When you find the blocked road the layer does not know about yet, this is how you tell Google and everyone behind you.
Frequently Asked Questions
How do I turn on the traffic layer in Google Maps?
On the phone, tap the Layers button near the top right of the map and select Traffic from the map details. On desktop, use the Layers control at the bottom left and choose Traffic. The roads then take on color wherever Google has traffic data.
What do the traffic colors mean in Google Maps?
Green means traffic is flowing at about its normal speed. Orange means a moderate slowdown. Red means heavy congestion, and dark red means the slowest, near-stopped conditions. A road with no color has too little data to judge, which is not the same as a clear road.
What is the difference between Live traffic and Typical traffic?
Live traffic shows conditions right now, built from phones currently moving on the road. Typical traffic, available on desktop, shows the congestion that is normal for a day and time you choose, which makes it the planning tool for trips you will take later.
Does Google Maps include traffic in its route times?
Yes. The estimated time on a route preview already reflects the traffic Google knows about along that route, and the route line itself is painted in traffic colors so you can see where the delay sits, not just the total it produces.
Why do some roads never show traffic colors?
The layer depends on enough phones traveling a road to judge its speed. Minor rural roads, very new roads, and regions with thin coverage may show no color at all. Read that as no data, and lean on the route time and a sensible departure buffer instead.
Photo credits: Luis Quintero (Pexels); Ehsan Haque (Pexels). Photos are served from this site; follow the credit to the library page for the original.