Ask how to find coordinates in QGIS and the honest answer is: which coordinates, for what? The pair under your mouse as you explore, one point captured exactly for a report, or the coordinates of ten thousand features written into a table for export are three different jobs, and QGIS has a purpose built tool for each. This guide covers all five routes worth knowing, in the order you will reach for them. But it starts with the trap that invalidates more QGIS coordinates than every other cause combined: the coordinate reference system (CRS). QGIS constantly translates between the CRS of your data layers and the CRS of the project, and every readout in this guide is expressed in one or the other. Read the number without knowing which system it is in, and you can be off by hundreds of kilometers while looking perfectly precise.
Home / Coordinates and Location Formats
How to Find Coordinates in QGIS: Status Bar, Copy Coordinates, and Field Calculator
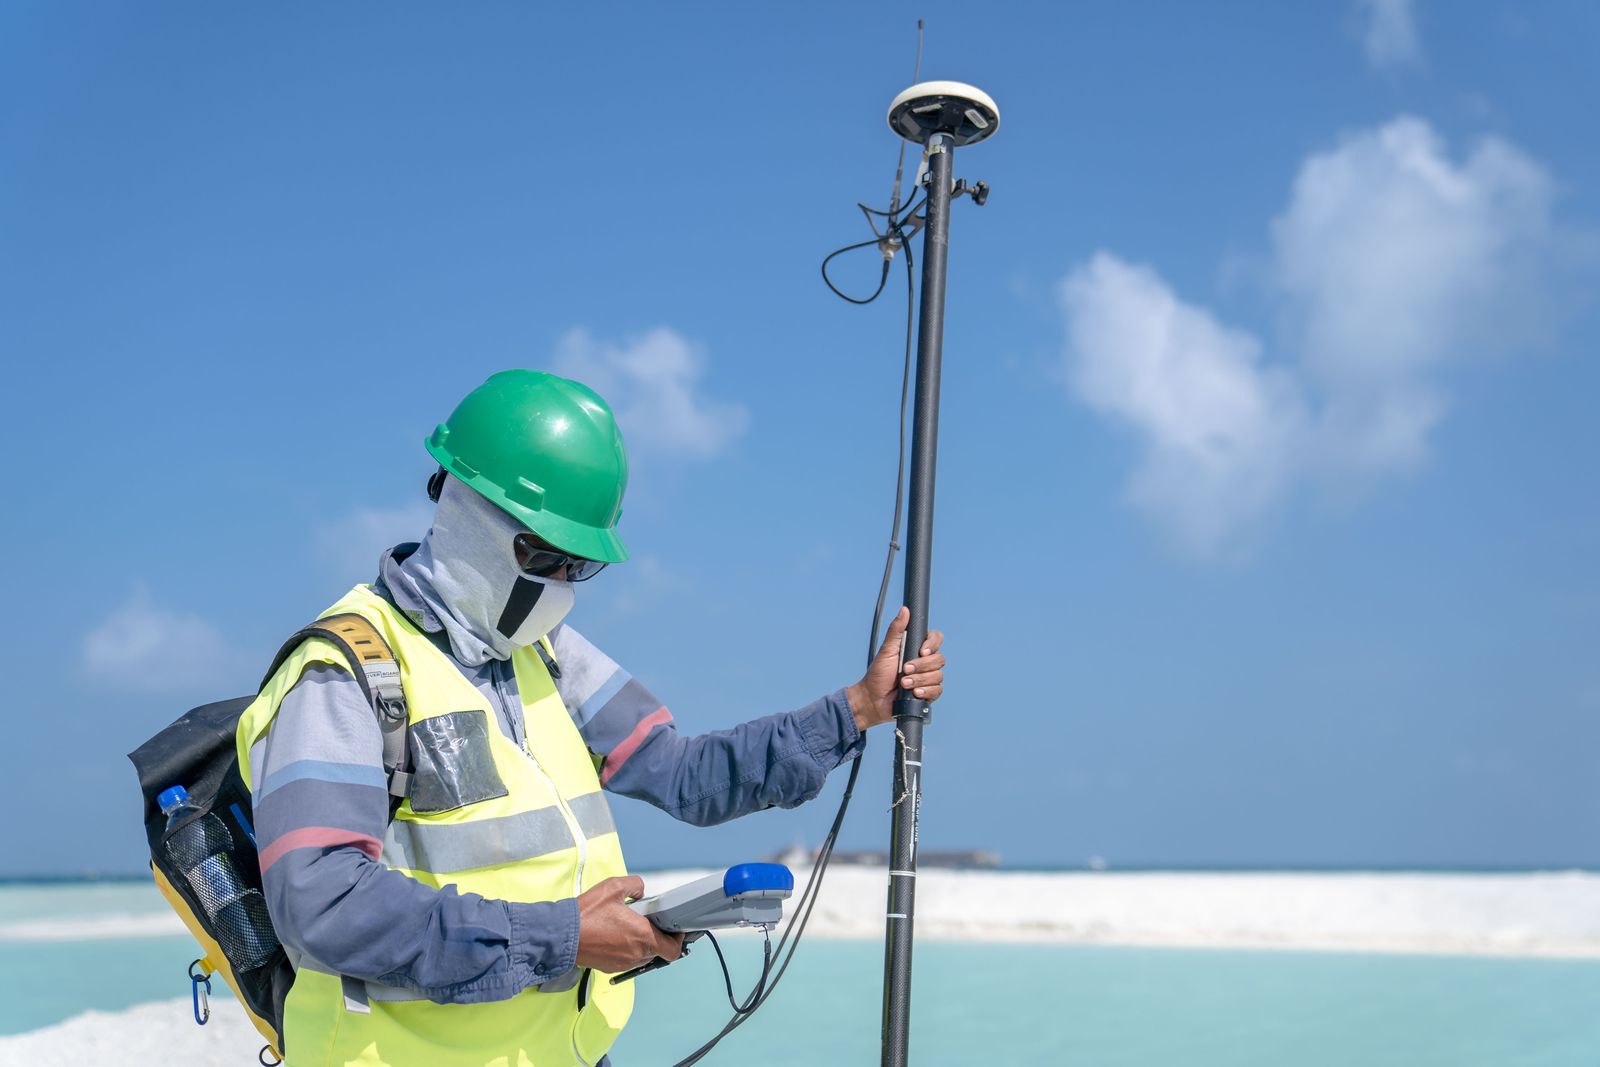
Photo: Asad Photo Maldives / Pexels
Coordinate Explorer: The Readout Habit
Move across the map and read the pair under your pointer, the same habit as the QGIS status bar. In QGIS the next question is always which CRS the readout speaks; here the pair is latitude and longitude.
Map data © OpenStreetMap contributors. Coordinates are read from the map itself, in the WGS 84 system your phone uses.
Before Anything: Know Which CRS You Are Reading
Every QGIS readout answers in a named system. The project CRS, shown in the bottom right of the status bar (a code like EPSG:4326 or EPSG:3857), governs the status bar and the map display. Each layer also has its own CRS, and attribute based tools report in the layer's system unless you tell them otherwise. EPSG:4326 is latitude and longitude in degrees, the language of GPS and of this site. Projected systems like UTM report in meters east and north of a zone origin. The numbers are not interchangeable: the same field corner is 51.5, minus 0.12 in degrees and roughly 699,000, 5,710,000 in a projected grid, and both are correct, in their systems. So the discipline is one sentence long: before recording any coordinate from QGIS, say its CRS out loud and write the code beside the number. If the readout shows enormous numbers when you expected degrees, your project is in a projected CRS; if it shows degrees when your report needs meters, the reverse. Changing the project CRS (click the EPSG code in the status bar) reprojects the display on the fly without altering your data, which is the safe way to read in the system you need. Our how to find coordinate system guide teaches the detective work for mystery numbers; here, just never skip the check.
Route One: The Status Bar Readout
For exploration, the fastest readout is already on your screen. Move the mouse across the map canvas and the status bar at the bottom shows the coordinate of the cursor position continuously, in the project CRS. It is the tool for questions like "roughly where is this field corner" or "what is the latitude of this bend in the river," answered to the precision of your zoom: zoom in and the readout's meaningful decimals grow. Two refinements make it trustworthy. First, the readout follows the project CRS, so set the project to EPSG:4326 when you want degrees. Second, for a readout you can cite, do not trust a moving cursor; use the next route, which captures a point deliberately. The status bar also hides a magnifier and scale display beside the coordinate, and clicking the coordinate area in some versions lets you type a coordinate and jump to it, the reverse journey. For adding your own known points to a layer, the companion task, see add gps coordinates to qgis, which builds the layer this guide then reads from.
Route Two: Right Click and Copy Coordinates
When you need one point, exactly, use the capture built for it. In recent QGIS versions, right click on the map canvas and choose Copy Coordinates: QGIS places the point's coordinate on your clipboard, formatted in the project CRS, ready to paste into a report, an email, or a spreadsheet. The right click menu also offers the coordinate in the layer's context when you click over a feature, and the copied value respects the project CRS, so the CRS check from the first section applies word for word. Where the menu item is missing (older versions and some builds), the Coordinate Capture plugin is the classic equivalent: enable it from the Plugins menu, click its panel button, then click the map, and the panel shows the coordinate in both the project CRS and latitude longitude, with a copy button for each. Either way, the habit that makes captured coordinates safe is to paste them immediately beside their CRS code and a plain language label ("gate post, EPSG:4326"), because a bare pair of numbers in a notebook is a riddle by next season.

Route Three: The Identify Tool and the Feature's Own Geometry
Sometimes the question is not "where did I click" but "what are this feature's coordinates": the vertex of a boundary, the node of a road, the centroid of a parcel. Select the layer, click the Identify Features tool (the i in a circle), and click the feature: the results panel shows its attributes and, in the derived section, geometry readouts that depend on the feature type, including the coordinate of the clicked point on the feature and measures like length and area. For the exact vertices of a line or polygon, open the Vertex Tool (in the digitizing toolbar): hovering a vertex shows and lets you edit its coordinate numerically in the vertex editor panel, in the layer CRS. That panel is the authoritative answer for "what coordinate did we store," as opposed to "where is my mouse," and confusing the two is a subtle source of error in shared projects. The identify route also exposes a quiet superpower: with several layers stacked, it reports the same click through each of them, which is how you discover that two layers disagree about where a boundary sits.
Route Four: $x and $y, Coordinates for Every Feature at Once
When the job is a table, use the Field Calculator. Open the layer's attribute table, toggle editing, open the Field Calculator (the abacus icon), choose Create a new field, name it (x_coord, type decimal), and enter the expression $x. Repeat with $y in a second field. QGIS evaluates the geometry functions for every feature: for points, $x and $y are the point's own coordinate; for lines and polygons, they return the centroid, a distinction that surprises people exactly once. The values are computed in the layer's CRS, so if the layer is projected and you need degrees, either reproject the layer first (right click, Export, Save Features As, choosing EPSG:4326) or wrap the expression in a transform. The functions belong to a family worth knowing: $area, $length, and $perimeter sit beside them, and the expression builder's help panel documents each with examples. This route is the bridge to spreadsheets and databases, and it is how a GIS stops being a picture and becomes a dataset. If your points began life as a table of pairs, how to use openstreetmap in qgis and the delimited text import are the reverse direction of the same bridge.
Route Five: Add Geometry Attributes and Export to CSV
The production version of route four is a Processing tool that does it in one pass and writes the result to a new layer: Add Geometry Attributes (in the Processing toolbox under Vector geometry, or from the Vector menu in older layouts). Run it on your layer and it appends coordinate fields computed properly for each geometry type, with options to calculate in the layer CRS, the project CRS, or an ellipsoid based measurement, and for points it writes the true point coordinates rather than a centroid fiction. Then right click the resulting layer, Export, Save Features As, CSV, and the file opens in any spreadsheet with a coordinate column beside every attribute, ready for mail merges, uploads, and joins. Choose the CSV's geometry encoding option deliberately: the AS_XY setting writes simple x and y columns, which is what most non GIS tools expect, while the WKT setting writes full geometry text for tools that can parse it. This is the route to use when the coordinates are deliverables, because it is repeatable: rerun it after edits and the table is never stale.
Putting It Together, and the Mistakes That Recur
The five routes form one habit: explore with the status bar, capture singles with copy coordinates, interrogate features with identify and the vertex editor, and produce tables with the field calculator or geometry attributes, checking the CRS at every step. The recurring mistakes are all versions of skipping that check or confusing the routes: reporting a centroid as if it were a surveyed corner, pasting projected meters into a form expecting degrees, or reading the status bar at country zoom and quoting six decimals of false precision. If you are new to the program itself, our qgis tutorial for beginners builds the foundation these routes stand on, and how to use qgis plugins covers the plugin system the Coordinate Capture route uses. Coordinates in QGIS are easy; coordinates you can defend are the same routes with the CRS spoken aloud.
Related Guides
This guide does not stand alone. The coordinates guides below take up the questions it leads into:
- How to Find a Coordinate Point in AutoCAD: ID, Status Bar, LIST, and Bulk Export: AutoCAD knows the coordinates of every point in a drawing, and offers five ways to read them, from the one click ID command to a full...
- How to Get Coordinates From a KML File: Text Editor, Google Earth, QGIS, and Code: A KML file is plain XML text, and its coordinates sit in the open, inside coordinates tags, in longitude, latitude, altitude order.
- Zoom to Coordinates in QGIS: The Lat Lon Tools Method, Without the Swap Trap: Someone hands you a coordinate pair and a QGIS project, and asks the simplest question in mapping: take me there.
Frequently Asked Questions
Where does QGIS show the coordinates of my mouse?
In the status bar at the bottom of the window, updated continuously as you move across the map canvas. The readout is in the project CRS, shown at the bottom right (for example EPSG:4326 for latitude and longitude). Zoom in for more meaningful precision.
How do I copy the exact coordinates of one point in QGIS?
Right click the point on the map canvas and choose Copy Coordinates; the pair is placed on your clipboard in the project CRS. In versions without that menu item, install the Coordinate Capture plugin, click its button, then click the map, and copy from its panel.
How do I get coordinates for all features in a layer?
Use the Field Calculator with the expressions $x and $y to create coordinate fields for every feature, or run the Add Geometry Attributes processing tool, then export the layer to CSV. For lines and polygons, $x and $y return the centroid, not a vertex.
Why are my QGIS coordinates huge numbers instead of degrees?
Your project or layer is in a projected CRS such as UTM or Web Mercator, which measures in meters. Change the project CRS to EPSG:4326 to read latitude and longitude, or export the layer reprojected to EPSG:4326 when you need the stored values themselves in degrees.
Are $x and $y in the layer CRS or the project CRS?
The layer CRS. Geometry functions evaluate the stored geometry in its own system. If the layer is projected and you need degrees, reproject a copy of the layer to EPSG:4326 first, or account for the system when you record the numbers.
Photo credits: Asad Photo Maldives (Pexels); Nelson Axigoth (Pexels). Photos are served from this site; follow the credit to the library page for the original.