When a wildfire starts anywhere near a route, a home, or a weekend plan, the first questions are always the same. Where exactly is it burning? How big is it, and is it contained? And is the air where I am going safe to breathe? Google Maps can answer all three, but only if you know the layers exist, because neither one is on by default. Hidden in the map details menu is a Wildfires layer that plots active fires with flame icons and red perimeter outlines, each with an incident card of official details. Next to it, an Air Quality layer paints the map in the colors of the Air Quality Index, which is how you read the smoke, and smoke travels far beyond any perimeter. This guide turns both on, teaches you to read them, and is honest about the line where a map layer ends and emergency information begins.
Google Maps Fires: How to See Wildfires, Smoke, and Air Quality on the Map
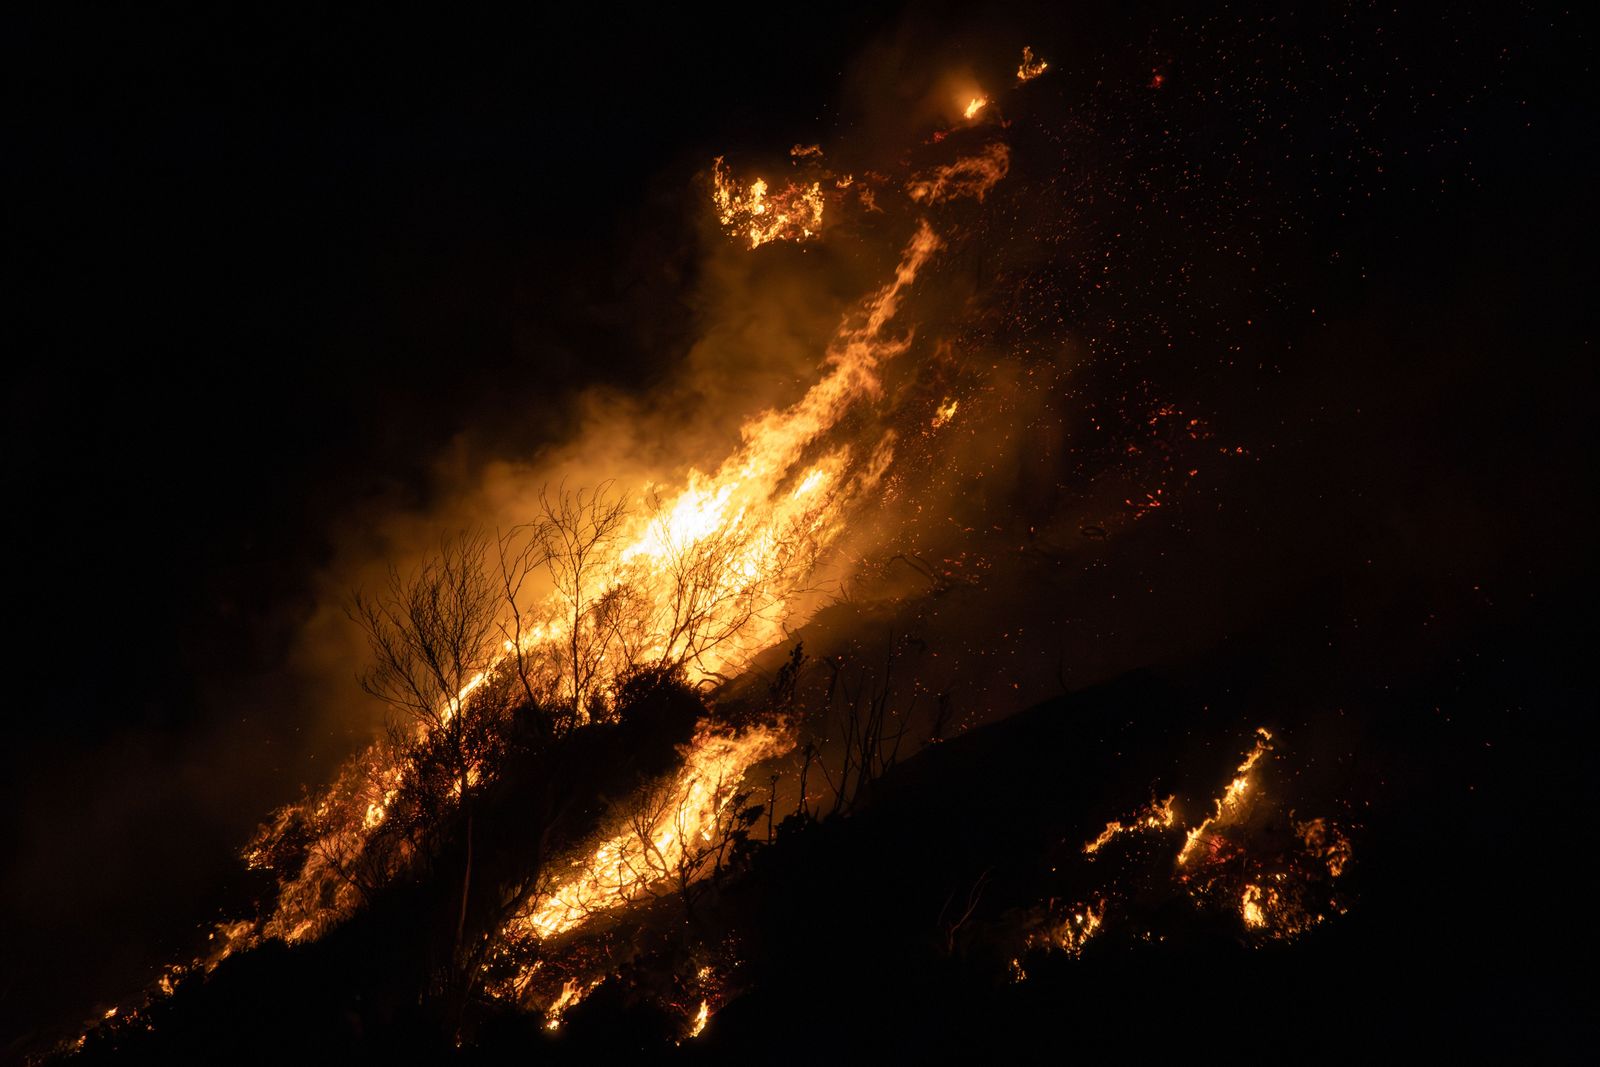
Photo: Andreas Berget / Pexels
Read the Fire Layer: The Checklist
Check off each step as you finish it. Your progress stays on this page.
0 of 7 complete
0% done
Turn On the Wildfires Layer
Open Google Maps and tap the Layers control, the stacked-diamond icon on the map. In the Map details section you will find Wildfires alongside the traffic, transit, and terrain options. Switch it on and the map changes where fires are active: flame icons mark incidents, and red polygons outline the mapped perimeters of the larger ones. The layer works at regional zoom, which is the right way to use it. Zoom out until you can see your whole area of concern, your town, your route, the campground, and read the fire geography at a glance: which fires exist, where they sit relative to the places you care about, and which way the situation is laid out. Zooming deep into a single perimeter tells you less than the regional picture, because the decisions this layer informs, go or do not go, this road or that one, are regional decisions.
The layer is a view, not an alert system. It shows what is known and mapped when you look, and it rewards a habit: check it before you travel, check it again at stops, and check it in the morning before a day outdoors in fire season. A perimeter you saw last night is history, not a promise.
Read a Fire: The Incident Card
Tap a flame icon or a perimeter and Google Maps opens the incident card. It names the fire, because wildfires get official incident names, and it shows the figures the responsible agencies publish: the acreage burned and the containment percentage, along with status details and, where authorities provide them, links or information about evacuations and closures. Read those two numbers like a local. Acreage tells you scale, and it grows; a fire measured in tens of acres near a road is a different problem from one measured in tens of thousands. Containment is the share of the perimeter that fire crews have secured with a control line, and it is the number that tells you whether the incident is being won or is still running. Zero percent contained and growing is a fire that is making its own decisions. High containment on a large fire is an incident being brought under control, though it can burn for weeks inside its lines.
Where the card offers evacuation information, treat it as a pointer, not the order itself. The order, its zones, and its routes come from your local authorities, the county sheriff, the emergency management agency, the official incident page, and those sources are the ones with legal force and the freshest detail. The map aggregates; the authority decides. Use the card to learn the incident name, because that name is the key that unlocks the official sources: search the name and you will find the incident page, the local briefings, and the evacuation map that governs your address.
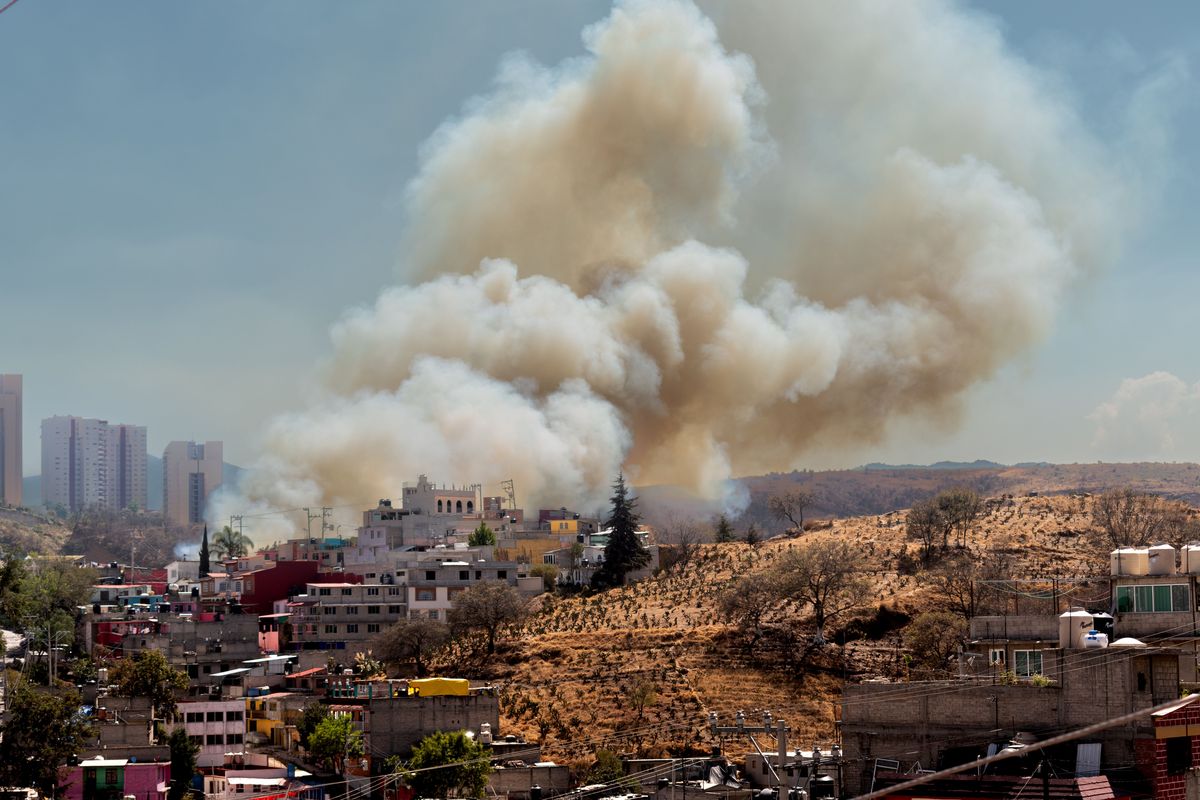
The Air Quality Layer and the AQI Scale
For most people, most of the time, the smoke matters more than the fire. A wildfire can be a hundred miles away and still turn your air orange, and the Air Quality layer is how Google Maps shows that. Turn it on from the same Map details menu and the map takes on color by the Air Quality Index, the EPA scale that runs from 0 to 500 and sorts air into six named categories. Tapping a spot gives the AQI value and the category for that location, measured and modeled from the monitoring network.
Learn the scale once and you can read any AQI number anywhere for life:
| AQI | Category | Color | What it means in plain terms |
|---|---|---|---|
| 0 to 50 | Good | Green | Air is clean; no special concern |
| 51 to 100 | Moderate | Yellow | Acceptable; unusually sensitive people take note |
| 101 to 150 | Unhealthy for Sensitive Groups | Orange | Children, older adults, and people with lung or heart conditions should ease up outdoors |
| 151 to 200 | Unhealthy | Red | Everyone may feel effects; cut prolonged outdoor exertion |
| 201 to 300 | Very Unhealthy | Purple | Health alert territory; move activities indoors |
| 301 and above | Hazardous | Maroon | Emergency conditions; stay indoors and follow local guidance |
The practical use is planning. A hike, a kids' soccer game, a long drive with the windows down: check the layer the way you check the weather, because in fire season smoke is weather. Notice also that the AQI at the fire and the AQI in your town are different questions, and the layer answers the second one, which is the one your lungs asked.
Where the Data Comes From
Neither layer is Google guessing. The wildfire information is drawn from official sources: satellite detections from NOAA and NASA instruments that spot heat from orbit, and incident data from the agencies coordinating the response, in the United States centered on the National Interagency Fire Center, which is the hub for the perimeter, acreage, and containment figures that land managers publish. The air quality data comes from the EPA monitoring network and its reporting system. That provenance is why the incident card uses official incident names and why the numbers match what local news reads out from the same feeds.
Provenance also explains the limits. Satellite detections have a revisit rhythm, perimeters are drawn by analysts from flights and reports, and containment is updated on briefing cycles, not by the second. The map is a current briefing, assembled from the best official data available, and in a fast-moving incident the ground truth can run ahead of any briefing. That is not a flaw in the layer; it is the nature of fire information, and it is why the next section exists.
What the Map Cannot Tell You
Google Maps will not tell you whether to evacuate, and you should not ask it to. Evacuation orders and warnings are issued by local authorities for defined zones, they change as the fire moves, and they are published through county emergency channels, official incident pages, and alert systems you can sign up for by address. The wildfire layer can show you a perimeter two ridges away; only your sheriff's office can tell you that your zone moved to a warning at noon. Build the habit in the right order: the map for orientation, the incident page for the official picture, and your local alert feed for decisions.
The same caution applies on the road. A route that Google Maps draws near a fire is a route through a changing situation: closures, smoke so thick the road disappears, and emergency traffic all belong to the live incident, not the basemap. If a road near a fire matters to you, verify it with the state or county road source before you drive it. Our guide to how to use Google Maps covers the everyday layer controls this feature extends, and in fire country the wildfire and air quality layers deserve a permanent place in that routine.
Putting the Two Layers to Work on a Trip
Used together, the layers answer the three questions from the start of this guide in about a minute. Turn on Wildfires and read the regional picture: any incident near your destination or along your route gets a tap, a name, an acreage, and a containment figure. Turn on Air Quality and read your destination's number against the table above, then read the number along the drive, because a route through a smoke plume is its own exposure. Then do the unglamorous final step the map cannot do: open the official incident page for any fire that matters, check your local alerts, and let those sources make the go or no-go call. Do that the night before and again in the morning, and you have used Google Maps fires exactly as well as it can be used: as the fastest orientation tool in a system where authorities decide and satellites watch.
Make It a Fire Season Habit
The layers reward routine more than urgency. In fire season, the households that use this feature well treat it like a weather check, because that is what it has become. The night before a drive through fire country, open the wildfire layer, tap any incident near the route, and note its name and containment; then read the air quality numbers at the destination and at the smoky midpoints of the drive. In the morning, look again, because both layers will have moved. Do the same before the events smoke quietly ruins: the outdoor wedding, the youth tournament, the harvest shift, the long run you trained for. A two-minute check the day before is worth more than an hour of improvisation inside a plume, and the incident name you noted the night before is the search term that takes you straight to the official page if conditions turn. None of this requires expertise. It requires treating the layers as a standing instrument in fire country, the way coastal households treat a tide table.
Related Guides
The closest companions to this guide are the map app guides below. Each one picks up a thread this page starts:
- How to Change the Voice in Google Maps: Change the Google Maps navigation voice on Android with the built-in Voice selection menu, and on iPhone by changing the system language voice,...
- How to See How Busy a Place Is on Google Maps: Popular Times, Live Bars, and Waits: Google Maps keeps a crowd diary for millions of places: a chart of how busy each one usually is, hour by hour and day by day, plus a live bar...
- Google Map to Image: Save, Print, Embed, or Generate a Map Picture: Getting a Google map out as an image is four different jobs wearing one search query.
Frequently Asked Questions
How do I turn on the wildfire layer in Google Maps?
Tap the Layers icon on the map, open the Map details section, and switch on Wildfires. Active fires appear as flame icons, larger ones with red perimeter polygons. Tap any fire to open its incident card with the official name, acreage, and containment.
What does the containment percentage on a fire mean?
Containment is the share of the fire's perimeter where crews have established a control line they expect to hold. A large fire at low containment is still growing and driving events; a fire at high containment is being brought under control, though it may keep burning inside its lines for a long time.
Where does Google Maps get its wildfire data?
From official sources: satellite heat detections from NOAA and NASA, and incident information coordinated through agencies such as the National Interagency Fire Center in the United States, including perimeters, acreage, and containment. The air quality layer draws on the EPA monitoring network behind the Air Quality Index.
Can Google Maps tell me if I need to evacuate?
No. Evacuation orders come only from local authorities, for named zones, through county emergency channels and official incident pages. Use the map to orient yourself and to find the incident name, then follow your local alert system and the incident page for orders that apply to your address.
Why check air quality if the fire is far away?
Because smoke travels much farther than flames. A fire a hundred miles off can push your local Air Quality Index into the orange or red range, which changes what a day outdoors does to you. The Air Quality layer shows the AQI where you are and where you are going, in the six EPA categories from Good to Hazardous.
Photo credits: Andreas Berget (Pexels); Jorge Romero (Pexels). Photos are served from this site; follow the credit to the library page for the original.